

Technically Speaking
Weekly Analysis: Grain Markets

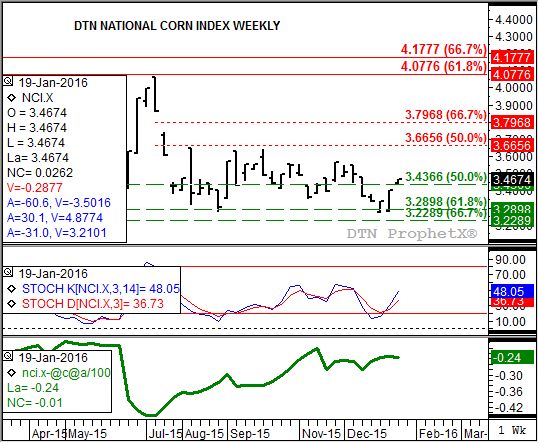
Corn (Cash): The DTN National Corn Index (NCI.X, national average cash price) closed at $3.46 3/4, up 6 1/2 cents for the week. While the secondary (intermediate-term) trend remains sideways, the NCI.X is nearing a move to an uptrend. The NCI.X left a bullish breakaway gap between the previous week's high of $3.40 1/4 and last week's low of $3.44, while putting itself in position to establish a new 4-week high above last week's peak (and close) $3.46 3/4 this coming week. A move above the December high of $3.56 1/2 would establish a bullish reversal on the monthly chart, signaling the major (long-term) trend has turned up again.
Corn (Old-crop futures): The March contract closed 7.00cts higher at $3.70 1/4. The secondary (intermediate-term) trend remains sideways with initial resistance at the 4-week high (last week's high) of $3.72 then the previous peak of $3.82 (week of December 7). However, the minor (short-term) uptrend looks to be nearing its end with as the contract tests resistance near $3.70 3/4, a price that marks the 67% retracement level of the previous minor downtrend from $3.82 through the contract low of $3.48 1/2. Daily stochastics are above the overbought level of 80%.
Corn (New-crop futures): The December 2016 contract closed at $3.92, up 6 3/4 cents for the week. Dec corn is similar to March in that its secondary (intermediate-term) trend remains sideways while indications are that the minor (short-term) uptrend is coming to an end. Initial secondary resistance is at the 4-week high (last week's high) of $3.93, then the previous peak of $4.03 1/2. Support is at the contract low of $3.77.
Soybeans (Cash): The DTN National Soybean Index (NSI.X, national average cash price) closed at $8.30 3/4, down 3 3/4 cents for the week. The secondary (intermediate-term) trend remains sideways. Support is at the triple-bottom low near $8.08 1/2 ($8.08 1/2, $8.09 1/4, $8.11 1/4) while resistance looks to be at roughly $8.48 (though the interim highs of the triple bottom are spikes to $8.57 1/2 and $8.60 1/2). A clear bullish breakout would imply a rally to near $8.90, while a bearish breakout would indicate an extended sell-off to near $7.70. However, monthly stochastics indicate the NSI.X is sharply oversold and nearing a confirming bullish crossover (the initial was posted at the end of November 2015).
P[L1] D[0x0] M[300x250] OOP[F] ADUNIT[] T[]
Soybeans (Old-crop futures): The March contract closed 2.50cts lower at $8.76 1/2. Both the secondary (intermediate-term) and minor (short-term)) trends remain sideways. Regarding the minor trend, March soybeans continue to find renewed selling interest between $8.81 3/4 and $8.91 3/4, prices that mark the 50% and 67% retracement levels of the previous sell-off from $9.11 1/2 through the low of $8.52.
Soybeans (New-crop futures): The November 2016 contract closed 1.50cts lower at $8.83 3/4. The secondary (intermediate-term) trend remains sideways between the recent high of $9.26 1/2 and the 4-week low of $8.68. Below that support is the contract low of $8.50.
SRW Wheat (Cash): The DTN SRW Wheat National Index (SR.X, national average cash price) closed at $4.33, up 1/2 cent for the week. Technically the secondary (intermediate-term) trend remains up despite last week's lower close and continued neutral-to-bearish weekly stochastics. The most recent signal was a bullish reversal on its weekly chart (week of January 4).
SRW Wheat (New-crop futures): The July 2016 Chicago contract closed 3/4ct higher at $4.85 1/4. Technically both the secondary (intermediate-term) and minor (short-term) trends remain up. Initial resistance is at the recent high of $4.94 3/4.
HRW Wheat (Cash): The DTN HRW Wheat National Index (HW.X, national average cash price) closed at $4.12 1/4, down 3 cents for the week. Despite the lower close the secondary (intermediate-term) trend remains up. Initial resistance is at the 4-week high of $4.21 3/4. Support is at the 4-week low of $3.95 1/4.
HRW Wheat (New-crop futures): The July 2016 Kansas City contract closed 2.75cts lower at $4.90 3/4. The secondary (intermediate-term) trend remains up with initial resistance is at the 4-week high of $5.02. Weekly stochastics are bullish above the oversold level of 20%.
HRS Wheat (Cash): The DTN HRS Wheat National Index (SW.X, national average cash price) closed at $4.73, down 2 cents for the week. The secondary (intermediate-term) trend remains down despite the recent consolidation pattern. Last week's low of $4.71 would signal the downtrend could resume with the target price being the major (long-term) low of $4.44.
HRS Wheat (New-crop futures): The September 2016 Minneapolis contract closed 1.75cts lower at $5.19. The secondary (intermediate-term) trend turned sideways as the contract equaled its low of $5.15 1/4 last week while weekly stochastics turned neutral below the oversold level of 20% once again. Resistance is at the 4-week high of $5.33 1/4. A bearish breakout would suggest an extended sell-off to $4.97 1/4. A bullish breakout would put the upside target at $5.51 1/4.
To track my thoughts on the markets throughout the day, follow me on Twitter: www.twitter.com\DarinNewsom
Comments
To comment, please Log In or Join our Community .