

Technically Speaking
Gold Bulls Have a Weekend to Dream
Another month has come and gone, and what a month it was. The main feature of most global markets was increased volatility creating wild weekly, daily, and intraday moves. However, sitting outside the fray, for the most part, was one of the calmer Kings of Commodities: Gold.
As discussed in my On the Market column "Two and a half Kings", gold was on the verge of establishing major (long-term) bullish technical signals on its monthly chart, depending on how it closed out the month of January. Now that the dust has settled, things really aren’t much clearer than they were at the beginning of the day.
P[L1] D[0x0] M[300x250] OOP[F] ADUNIT[] T[]
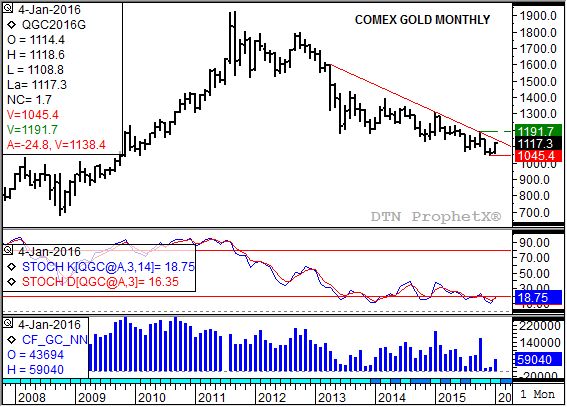
Gold did indeed close higher for the month, finishing at $1,118.10 as compared to December's settlement of $1,060.00. This higher close led to another bullish crossover by monthly stochastics (middle study, faster moving blue line crossing above the slower moving red line) below the oversold level of 20%. And finally, the final weekly CFTC Commitments of Traders report of the month showed noncommercial interests increasing their net-long futures position (bottom study) to 59,040 contracts, as compared to December's final 19,102 contracts. In other words, all systems are "go" for gold to finally break out of the major downtrend it has been in since 2011.
But, and there always seems to be a "but" when talking about commodities and uptrends, it could be argued that the market still has some work to do. The simplest definition of a downtrend is lower highs and lower lows. As you can see on the chart, gold has consistently posted spike highs before falling to new lows, with each high failing to move above the previous peak.
For gold bugs to really turn bullish, the more active contract (now the April contract) needs to climb above the previous high of $1,191.70 (dashed green line) from October 2015. To do that the market is going to need to see continued noncommercial buying, more than just a one month spike in interest.
That may be easier said than done given the sharp rally in the U.S. dollar index (USDX) to close out the month. The USDX rallied a full 1.000 Friday, leaving it within striking distance of its double-top highs (100.390 from March 2015, 100.510 from December 2015). Its monthly close only chart continues to show an uptrend that could stretch to the target area between 101.700 and 104.100. If that's the case gold, and the rest of the commodity sector, is going to have trouble building on bullish technical signals.
To track my thoughts on the markets throughout the day, follow me on Twitter:www.twitter.com\Darin Newsom

Comments
To comment, please Log In or Join our Community .