

Technically Speaking
Carrying Corn
As I talked about in Friday's On the Market column, "Carry On Chicago", the corn market's 2015-2016 forward curve (series of futures spreads) continues to indicate a far different supply and demand situation than what USDA continues to project. For context, let's review the latter's recently released December set of data:
1) 2015 corn production is still pegged at 13.654 bb, the third largest crop on record (trailing only 2014 and 2013) 2) Total supplies are estimated at 15.415 bb, the largest on record 3) 2015-2016 ending stocks were projected to be 1.785 bb, the largest since the beginning corn's demand market back in 2006 resulting in 4) ending stocks-to-use of 13.1% the second largest of the demand market decade. For a great discussion of corn's stocks and ending stocks-to-use, see DTN Contributing Analyst Elaine Kub's latest column, "How Many Days until We Run Out".
P[L1] D[0x0] M[300x250] OOP[F] ADUNIT[] T[]
These numbers are unquestionably bearish. However, from a technical point of view, the corn market is showing a different, far more bullish, view of supply and demand. During the Ag Summit breakout session I did with friend/farmer/analyst Tregg Cronin I discussed my rules for analyzing markets. Rule 1 has always been, "Don't get crossways with the trend (price direction over time)." And when talking about trend(s), I mean of futures, spreads, and basis.
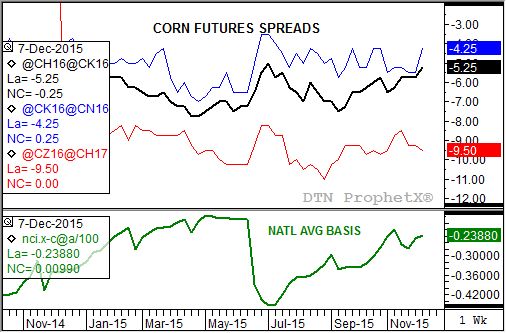
The top chart (see attached) shows the trends of corn's March to May (black line), May to July (blue line), and next marketing year's December to March (red line) futures spreads. Focusing on the old-crop March to May and May to July we see that both are trending up. In this case, an uptrend in futures spreads reflects a weakening carry with the March/May at 5 1/4 cents and the May/July 4 1/4 cents early Friday. Analyzed on a total cost of carry table both reflect a neutral view by commercial traders, leaning toward the bullish side.
As for national average basis (bottom study, DTN National Corn Index minus the most active futures contract), the trend is also up. Here an uptrend reflects a strengthening cash market versus futures, with Thursday's calculation of the DTN National Corn Index (NCI.X, national average cash price) at approximately $3.54 3/4 putting national average basis at roughly 24 1/2 cents under. This is slightly (about 1/4 cent) stronger than last Friday's calculation, and in line with both its 5-year and 10-year seasonal marks (24 cents under and 26 cents under respectively).
The question remains, why is corn's commercial view so much more bullish than USDA's? I discussed some of the possible answers in the aforementioned "Carry On Chicago" column with more on-farm storage, tightly held supplies heading into winter, and "miscalculated" production all making the list.
Time will tell how this will play out but for now, from a technical point of view, the commercial side of the corn market continues to grow more bullish. As always, keep a close eye on the trends for signs of the market changing its opinion on real fundamentals.
o track my thoughts on the markets throughout the day, follow me on Twitter:www.twitter.com\Darin Newsom

Comments
To comment, please Log In or Join our Community .