

Technically Speaking
USDX: Can We Believe What We See?

The divergence between logic and technical analysis grew once again last week as the U.S. dollar index (USDX) posted another bearish technical signal on its weekly chart. This as the rest of the world waits for the tap-in putt that is the expected rate increase by the U.S. Federal Reserve next week, a move that has long been thought to send the USDX racing well beyond the 100.000 mark.
But before this absolute certainty occurs, supposedly, on December 16, let's read the latest break in the green known as the weekly chart. Those familiar with this blog will take a look at last week's activity and immediately see what I see. For those who are new to the neighborhood, we'll discuss.
P[L1] D[0x0] M[300x250] OOP[F] ADUNIT[] T[]
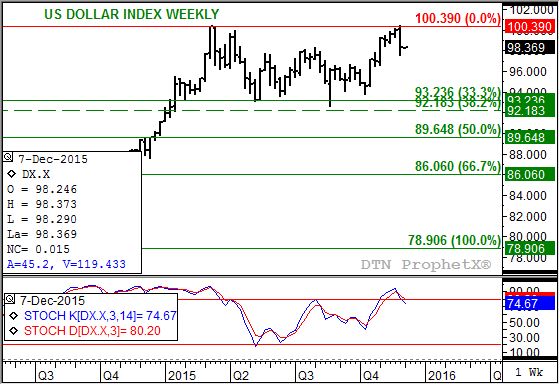
Last week saw the USDX move to a new long-term high of 100.510 before, and this is key, falling below the previous week's low of 99.312 and closing lower for the week at 98.354. This is a classic bearish reversal signaling a move to a secondary (intermediate-term) downtrend. Furthermore, it could be argued that last week's high (100.510) established a double-top formation with the previous peak of 100.390 (week of March 9, 2015).
Cue the infomercial slogan: "But wait, there's more!"
Also note that weekly stochastics (bottom study) established a bearish crossover above the overbought level of 80% at last Friday's close. A bearish crossover is when the faster moving blue line crossed below the slower moving red line, with both above 80%. Normally, a strange phrase to use these days, this confirms other technical signals that the trend has turned down.
So what's next? If we lived in a world where technical patterns were more reliable than they've proven to be in 2015, I would say the USDX is destined to once again test support between 93.236 and 92.183, just as it did between May 2015 and August 2015. If the USDX falls below the November low of 96.635 in December it would establish a major bearish reversal on the monthly chart. The USDX is already showing signs of a 2-month bearish reversal indicating a move to a major (long-term) downtrend.
But it's only December 6, and there is a lot of month ahead. While all technical indicators hint at an extended sell-off, money could quickly flow back into the USDX if the Fed finally makes its interest rate move.
Can we believe what we see on the charts, both weekly and monthly? Time will tell.
To track my thoughts on the markets throughout the day, follow me on Twitter:www.twitter.com\Darin Newsom
Comments
To comment, please Log In or Join our Community .