

Technically Speaking
Monthly Analysis: Energy Markets
Brent Crude Oil: The spot-month contract closed at $44.61, down $4.95 on the monthly chart. The major (long-term) trend remains sideways as the spot-month contract continues to consolidate within August's range from $54.32 to $42.23. Monthly stochastics are below the oversold level of 20% but still not indicating a move toward establishing a bullish crossover.
Crude Oil: The spot-month contract closed at $41.65, down $4.94 on the monthly chart. The major (long-term) trend looks to be sideways with support at the low of $37.75 (August 2015) and resistance at $50.92 (high from October 2015), creating a range of $13.15. Breakout targets, based on this range, would be $64.07 (bullish) and $24.60 (bearish).
P[L1] D[0x0] M[300x250] OOP[F] ADUNIT[] T[]
Distillates: The spot-month contract closed at $1.3369, down 16.25cts on the monthly chart. The major (long-term) trend is down as the spot-month contract moved to a new major low of $1.3217 in November. Monthly stochastics are in single-digits reflecting a sharply oversold situation. However, the market is showing no sign of a bullish turn as it trades at its lowest level since April 2009.
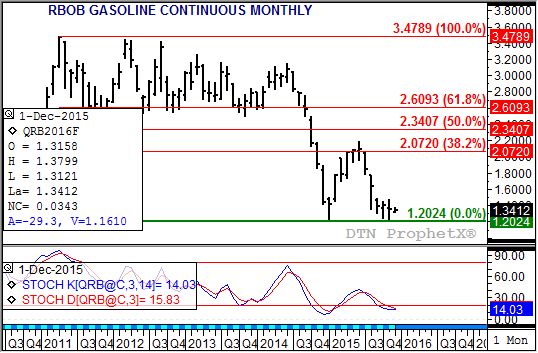
Gasoline: The spot-month contract closed at $1.3587, down 4.63cts on the monthly chart. Despite the move to a new low of $1.2024 in November the market looks to be in a consolidation phase. Monthly stochastics look to be working toward a bullish crossover below the 20% level, a possible secondary (confirming) signal to the original bullish crossover established at the end of February 2015. Initial resistance is at the September high of $1.4868.
Ethanol: The spot-month contract closed at $1.490 down 11.2cts on the monthly chart. The major (long-term) trend is sideways despite the most recent signal by monthly stochastics being a bullish crossover at the end of April 2015. Resistance is pegged at $1.712, a price that marks the 23.6% retracement level of the previous downtrend from $3.070 (July 2011) through the low of $1.292 (January 2015). This resistance held the previous rally, posting a high of $1.709 in May 2015. Support is at the August 2015 low of $1.400, then the major low of $1.292 (January 2015).
Natural Gas: The spot-month contract closed at $2.235, down 8.6cts on the monthly chart. The major (long-term) trend is sideways as the market consolidated within the October trading range of $2.578 to $1.948 during November. Monthly stochastics remain bullish below the oversold level of 20%, indicating the market could eventually see a bullish breakout.
Propane (Conway cash price): Conway propane closed at $0.3750, down 4.38cts on its monthly chart. Despite the lower monthly close the major (long-term) trend remains up with a target of $0.5542. This price marks the 23.6% retracement level of the previous major downtrend from $1.4825 (December 2013) through the low of $0.2675 (June 2015).
To track my thoughts on the markets throughout the day, follow me on Twitter: www.twitter.com\DarinNewsom

Comments
To comment, please Log In or Join our Community .