

Technically Speaking
Bullishness in Corn? It's Spreading!

Most of you following DTN analysis for any length of time know the importance we put on futures spreads. In this day and age of computer trade gone wild, particularly in reaction to USDA reports, the best read on real market fundamentals remains futures spreads.
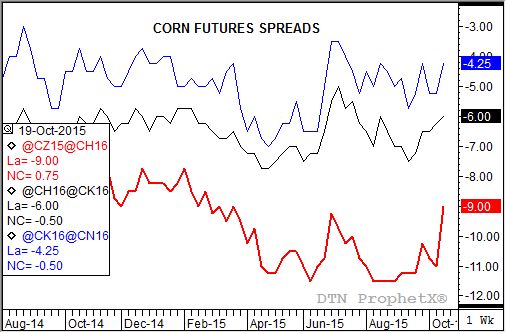
Take a look at the attached chart and what do you see? For those that don't have the picture there are three jagged lines cutting across the page; a thick red line (the December to March futures spread), a thin black line (March to May), and a thin blue line (May to July). The link between all three, according to this weekly close study, is the trend for all of them has turned up.
Okay, so what does an uptrend in a futures spread mean? In the case of these three corn spreads an uptrend means weakening carry, and weakening carry reflects a more bullish view of real market supply and demand.
P[L1] D[0x0] M[300x250] OOP[F] ADUNIT[] T[]
Of these three spreads the one I'm more interested in is the nearby December to March (again, thick red line). Note that after it closed four consecutive weeks (from the week of August 10 through the week of August 31) at the 11 1/2 cent carry mark, it has been trending up. This past Friday saw the spread close at 9 cents (carry), slightly above the 9 1/4 cents from the week of June 29 and the weakest carry the spread has closed at since Friday, March 27. Also note that the deferred spreads closed at the 6 cent carry level (March to May) and 4 1/4 cents carry (May to July).
If we compare these closes to the total cost of carry, not only for the November to June time frame but spread by spread, we see the commercial side of the market continues to hold a neutral view of market fundamentals, a far cry from the bearish picture USDA continues to try and sell. For instance, the 9 cent carry weekly close in the December to March is roughly 50% of the 18 cents total carry (commercial storage plus interest) calculated through the end of February. The carry from the December to July contract, 19 1/4 cents, comes to about 45% of the calculated total cost of carry through June of 42 1/2 cents.
As for the other individual spreads the March to May close at 6 cents carry is also approximately 50% of total carry, while the May to July at 4 1/4 cents covers only 34% of total calculated carry.
Going back to my grains merchandising days, I've always tried to keep things as simple as possible. When analyzing carry I break it into thirds: A spread with a carry greater than 67% of total cost of carry is considered bearish, while a spread with carry less than 33% is viewed as bullish. The middle ground with carry between 34% and 66% of total is seen as varying degrees of neutral. In corn then, all three spreads would be reflecting a neutral view of the market's real supply and demand situation, with the May to July bordering on turning bullish.
Knowing this helps to clear up some of the questions about the corn market. Seasonally both futures and cash (DTN National Corn Index, national average cash price) tend to rally from early October through early summer (based on a 10-year seasonal index, but more on this in a later blog or column). Also, both markets (futures and cash) continue to show long-term uptrends on monthly charts, needing a catalyst to spark increased buying interest.
And that catalyst could turn out to be the uptrend in spreads.
To track my thoughts on the markets throughout the day, follow me on Twitter:www.twitter.com\Darin Newsom
Comments
To comment, please Log In or Join our Community .