

Technically Speaking
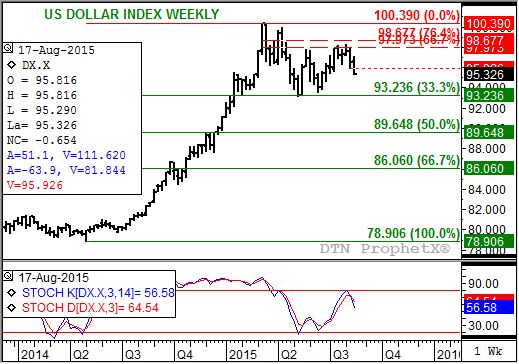
USDX: New 4-Week Low

This past week saw the Federal Reserve hedge its comments on a September Fed Fund rate hike, renewed pressure in the U.S. dollar index (USDX) that lead to the establishment of a new 4-year low.
Whew! That was quite a sentence. Let's break it down a bit.
First, some of the uptrend in the USDX from May 2014 through March 2015 was based on the assumption the Federal Reserve would finally raise the Fed Fund rate in 2015. As the year has worn on the presumed date for such a move has been moved back from June, to at least three beginning in September, to maybe not happening until 2016. With interest rates the key fundamental to the USDX, moves on its weekly charts has reflected the change in tide regarding increases.
After posting a high of 100.390 the week of March 9, 2015, the USDX established signals indicating the secondary (intermediate-term) trend had turned down. Weekly stochastics (bottom study) saw a bearish crossover above the overbought level of 80%, confirming the 2-week reversal seen on the weekly chart. The rally that followed was unable to take the USDX to a new high, topping out at 99.990 the week of April 13 as weekly stochastics grew more bearish. Eventually the USDX tested initial support at 92.326, the 33% retracement level of its previous secondary uptrend from 78.906 through the March high.
At that time, mid-May, talk of a Fed move heated up again leading to a recovery rally that tested resistance between 97.973 and 98.677, the 67% to 76.4% retracement levels of the initial sell-off through the low of 93.133. As would be expected, from a technical point of view, the rally stopped there and the USDX looked to turn down again. However, it was reluctant to post a bearish technical signal until this week when it moved below its previous 4-week low of 95.926 (red dotted line) led to another bearish crossover by weekly stochastics.
The USDX now looks to have rejoined its secondary (and major) downtrend with initial support still pegged at 93.236. However, a 50% retracement of its previous secondary uptrend would result in a test of 89.648, a level that is in line with major (long-term) support on the monthly chart between 90.503 and 89.048. These levels mark the 33% and 38.2% retracements of the previous major uptrend from 70.698 (March 2008) through the March 2015 high (100.390).
To track my thoughts on the markets throughout the day, follow me on Twitter:www.twitter.com\Darin Newsom
P[L1] D[0x0] M[300x250] OOP[F] ADUNIT[] T[]
Comments
To comment, please Log In or Join our Community .