

Technically Speaking
Monthly Analysis: Grain Markets

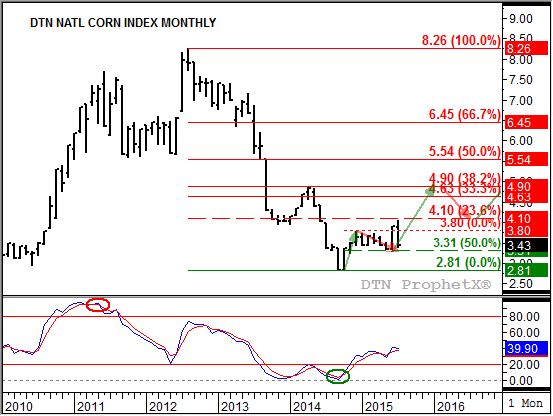
Corn (Cash): The DTN National Corn Index (NCI.X, national average cash price) closed at $3.43, down 47 cents for the month. Despite the sharp sell-off in July the market remains in a major (long-term) 5-wave uptrend pattern. It could be important, but not critical, for the NCI.X to hold above its June low $3.29. Monthly stochastics are still bullish indicating long-term momentum is to the upside.
Corn (Futures): The December contract closed at $3.81 1/4, down 40 3/4 cents on the monthly chart. Despite the sell-off seen in July the market remains in a major (long-term) uptrend. June's activity, including a move above the December 2014 high of $4.17, confirmed the market was in Wave 3 of a 5-wave uptrend. Monthly stochastics remain bullish indicating corn should regain its upside momentum. Support is at the June low of $3.46 3/4.
P[L1] D[0x0] M[300x250] OOP[F] ADUNIT[] T[]
Soybeans (Cash): The DTN National Soybean Index (NSI.X, national average cash price) closed at $9.38, down $0.74 for the month. Despite the lower monthly close the market remains in a major (long-term) uptrend. Going back to the end of June, the NSI.X had moved above its Wave 1 peak of $10.08 indicating it had established Wave 3. Monthly stochastics remain bullish below thee oversold level of 20%, but are still showing little upside momentum. Support is at the May 2015 low of $8.88.
Soybeans (Futures): The November contract closed at $9.40 1/4, down $0.97 on the monthly chart. Soybean futures failed to confirm a move into Wave 3 of a major (long-term) 5-wave uptrend, posting a high below the peak of Wave 1 of $10.86 1/4 (November 2014). The sharp sell-off in July has the market in a major sideways trend, threatening support at the October 2014 low of $9.04. Monthly stochastics are neutral, well below the oversold level of 20%. It will be important during the month of August to see how the November contract acts in relation to the support level of $9.04.
Wheat (Cash): The DTN National SRW Wheat Index (SR.X, national average cash price) closed at $4.43, down $1.36 cents for the month. The sharp sell-off seen in July has turned the major (long-term) trend sideways with thee SR.X testing support at the April 2015 low of $4.42. Below that is the September 2014 low of $4.25. Resistance at $6.00 continues to hold.
SRW Wheat (Futures): The September Chicago contract closed at $4.99 1/4 down $1.16 1/24 on the monthly chart. The major (long-term) trend looks to have turned sideways again. Support is at the May 2015 low of $4.60 3/4 while resistance at thee December 2015 high of $6.77 continues to hold. Monthly stochastics are neutral-to-bullish, holding above the oversold level of 20%.
To track my thoughts on the markets throughout the day, follow me on Twitter: www.twitter.com\DarinNewsom
Comments
To comment, please Log In or Join our Community .