

Technically Speaking
Dec Corn: Under the Microscope

Those familiar with my analysis know I look at three different time frames when it comes to charts, loosely applying Fractal Theory (My interpretation: The idea that the same patterns can be seen on any scale.) to monthly (long-term), weekly (intermediate-term), and daily (short-term) charts. As you know I spend most of my time on weekly and monthly charts due to my belief that signals there are far more meaningful.
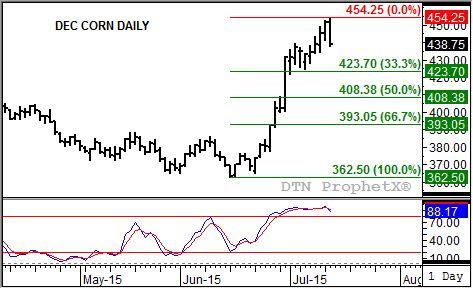
But that isn't to say that interesting things can't happen on a daily chart. Take a look at what occurred Tuesday in December corn, and frequent readers of this blog will immediately see a familiar pattern. The contract moved to a new high (for this uptrend) of $4.54 1/4 early Tuesday before falling below Monday's low of $4.41 1/2 and closing at $4.38 3/4, near its daily low ($4.38) and off 13 cents for the day. This is a textbook example of a key bearish reversal.
P[L1] D[0x0] M[300x250] OOP[F] ADUNIT[] T[]
But what does that mean? If this were to occur on a monthly chart (e.g. June 2011 in corn) or a weekly chart (corn again, week of December 29, 2014) then the bearish signal would be far more significant. This pattern on a monthly chart indicates the major trend has turned down, while the most recent key bearish key reversal on the weekly chart signaled a move into Wave 2 (retracement wave) of the ongoing major uptrend in corn that began at the end of October 2014.
Tuesday's signal on Dec corn's daily chart doesn't carry the same weight, but it shouldn't be ignored. It indicates the secondary uptrend on the weekly chart could be set to take a breather, with initial support near $4.23 3/4. This price marks the 33% retracement level of the previous minor (short-term) uptrend on the contract's daily chart.
However, if the contract were to test support at its 33% retracement this week, it could have a more serious consequence on the daily chart. Last week's low in Dec corn was $4.24 1/2, so a move all the back to near $4.23 3/4 would then establish a key bearish reversal on its weekly chart as well. Weekly stochastics are not indicating such a thing should happen, but it remains a possibility of pressure continues to build on the contract and noncommercial interests don't step into to defend their recently established net-long futures position.
In the big picture, corn shapes up like this: The major trend remains up, firmly entrenched in Wave 3 that should eventually take the market to a test of $5.20 (possibly in January 2016); the secondary trend also remains up (for now), though weekly stochastics are nearing the overbought 80% level hinting that a short-term pullback is possible; meaning the minor downtrend isn't all that surprising or dangerous, as long as this week's sell-off is held in check.
Stay tuned, things could get interesting through the end of this week.
To track my thoughts on the markets throughout the day, follow me on Twitter:www.twitter.com\Darin Newsom
Comments
To comment, please Log In or Join our Community .