

Technically Speaking
More Long-Tem Bullish Signals in Soybeans

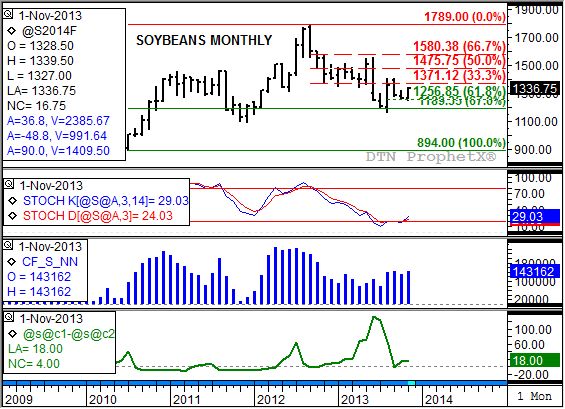
The soybean market continues to grow more bullish, as indicated by the establishment of a secondary bullish outside month on the long-term monthly chart. This follows the bullish key reversal posted in August, a pattern that coincided with a bullish crossover by monthly stochastics (second study). Combined, these two technical signals indicate the major (long-term) trend is up. The secondary outside month posted in November means the more active contract (the January issue) traded below the October low of $12.61 3/4 before rallying above the October high of $13.18 3/4 and closing higher for the month.
A look at the monthly chart shows initial resistance is near $13.71, a price that marks the 33% retracement level of the downtrend from $17.89 (high of September 12) through the August 2013 low of $11.62 1/2. Given the continued bullish commercial outlook, reflected in the inverted nearby futures spread (bottom study, green line) the market would be expected to see a 50% to 67% retracement. This puts the longer-term target between $14.75 3/4 and $15.80 1/2.
It is also interesting to note that, according to CFTC Commitments of Traders numbers, noncommercial traders are adding to their net-long futures position (third study, blue histogram). While the latest numbers will not be available until Monday, December 2, the previous report (for the week ending Tuesday, November 19) showed this group holding a net-long futures position of 143,162 contracts. This compared to the 131,254 contracts at the end of October, and the 165,762 contracts at the end of September.
To track my thoughts on the markets throughout the day, follow me on Twitter: www.twitter.com\DarinNewsom
P[L1] D[0x0] M[300x250] OOP[F] ADUNIT[] T[]
Comments
To comment, please Log In or Join our Community .