

Technically Speaking
An Odd Broadening Pattern in Jan Beans

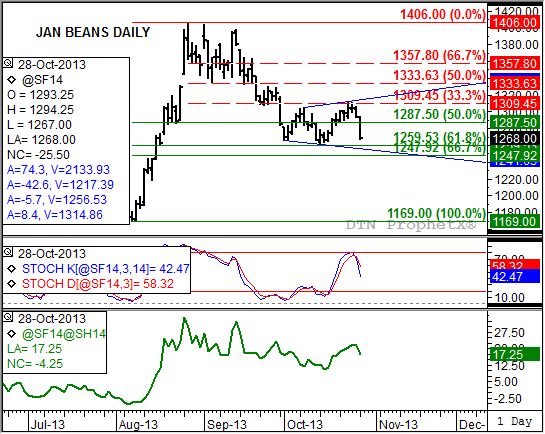
Despite continued bullish long-term commercial outlook, as indicated by the inverse in the Jan to March soybean futures spread (bottom study, green line), the January soybean contract was punched in the gut Monday, closing within striking distance of key technical price support.
The sell-off of about 25 cents left the contract in position to test its recent lows of $12.65 1/2 and $12.61 1/4, both near technical support at $12.59 1/2. This price marks the 61.8% retracement level of the previous uptrend from $11.69 through the high of $14.06. The 67% retracement level (not shown) is calculated near $12.48
Take another look at the pattern and you'll notice something interesting. On the daily chart for Jan beans, the lows keep getting lower ($12.65 1/2, 12.61 1/4) while the highs got higher ($13.05, $13.12 3/4). This could be viewed as a reverse triangle, or broadening formation. These patterns are relatively rare, but what makes this one even more peculiar is that it is occurring at the lower end of a downtrend rather than its usual place at the top end of an uptrend.
A breaking of the trendline created by connecting the lows would coincide with the breaking of retracement support between the 61.8% and 67% levels. If this break occurs, the projected target would be near the previous low of $11.69 posted on August 7. If this support (both trendline and retracement) holds though, it would indicate a possible move back up to another new high and the pattern continuing to broaden. It will be interesting to see how fast daily stochastics (middle study) move into an oversold situation below 20%, indicating a possible return move higher.
Stay tuned.
To track my thoughts on the markets throughout the day, follow me on Twitter: www.twitter.com\DarinNewsom
P[L1] D[0x0] M[300x250] OOP[F] ADUNIT[] T[]
Comments
To comment, please Log In or Join our Community .