

Technically Speaking
Bullish Bean Spreads
I realize that four of my last five blogs have been about soybeans. If I'm getting repetitive, I apologize. Yet as I look across the broad scope of commodities few are showing as many interesting signals as soybeans. Outside of the recently established uptrend in natural gas, there are few markets showing much more than sideways trends and fewer still with technical patterns worth discussing.
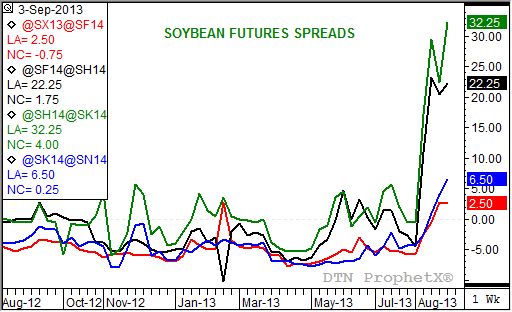
With that in mind, let me introduce another soybean chart. This one looks at the spreads for the 2013-2014 marketing year including the November to January (red line), the January to March (black line), March to May (green line), and May to July (blue line). The first thing you should see is the common theme off to the right hand side; that all four spreads are trending up. In this case that means the inverse in the forward curve (series of futures spreads) is growing stronger reflecting an increasingly bullish market outlook toward supply and demand.
If we take the spreads apart, we can find points of interest for each. For example, the November to January is showing an inverse of only 2 1/2 cents because early harvest has begun in parts of the southern growing areas, putting light pressure on the November contract and weakening national average basis (Friday evening saw the DTN National Soybean Index 53 cents over the November contract, as compared to the previous Friday's 70 cents over). Still, this year's weekly close ahead of the September USDA Supply and Demand report shows a stronger inverse than what was seen in 2012, when the pre-report average estimate for 2012-2013 ending stocks was a mere 106 million bushels.
The January to March spread closed this last Friday an inverse of 22 1/4 cents. Obviously, traders are more concerned about this time frame as cash sales keeping a lid on the November to January are expected to dry up. Finding supplies to meet demand over the second quarter of 2013-2014 (December through February) looks to be more difficult, and if the inverse holds together should start to firm basis as well.
Jumping ahead to the May to July spread, the close at the relatively small inverse of 6 1/2 cents is not surprising. South American supplies are expected to take demand away from the United States, as normally happens. However, the fact that the spread remains inverted should keep our attention in case something happens in either Argentina or Brazil.
This brings us back to the incredible move seen in the March to May futures spread. Friday's close saw the spread finish at an inverse of 32 1/4 cents, take out the previous high weekly close of 29 1/2 cents (week of August 19). If South America is expected to raise another record crop next year, why then is the March to May spread posting such a strong uptrend? The answer could lie in weather, as usual. Talk this summer is that conditions in both Brazil and Argentina could lead to a later planting season, possibly pushing harvest back and putting more reliance on what is expected to be a tightening U.S. supply situation.
As of this writing, I have not yet seen the average pre-report estimate for the 2013 round of September Supply and Demand numbers. Yet, having watched the game played for many years it is safe to assume USDA will not cut ending stocks with a chain saw, but rather a dull pocket knife. Time is on USDA's side on and it knows it, so large scale changes don't need to be made to the bottom line (ending stocks). On the other hand, for a more accurate reflection of market fundamentals, stay closely tuned to action in these spreads.
P[L1] D[0x0] M[300x250] OOP[F] ADUNIT[] T[]
To track my thoughts on the markets throughout the day, follow me on Twitter: www.twitter.com\DarinNewsom

Comments
To comment, please Log In or Join our Community .