

Technically Speaking
Short-Term Pressure in Nov Beans

As I've said many times in the past, I use three different timeframes to study trend: daily (short-term), weekly (intermediate-term), and monthly (long-term). Recently, I've discussed bullish technical signals on the weekly chart for November soybeans (August 24) and the long-term monthly chart (August 19). Following the recent strong rally, the short-term daily chart is signaling the November contract may have gone about as far as it can go for now.
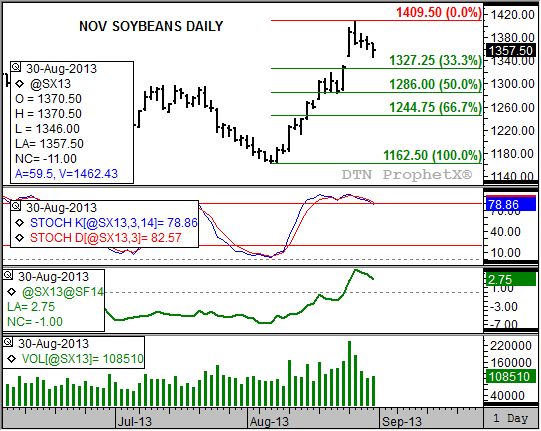
November soybeans hit a high last week of $14.09 1/2, an almost exact test of its previous high of $14.09 3/4 (on the weekly chart, high from the week of September 9, 2012). Nov beans posted its most recent high on Tuesday, August 27 as daily volume (bottom study, green histogram) at 236,119 contracts. Notice on the daily chart though (top chart), that the contract actually closed lower that day.
P[L1] D[0x0] M[300x250] OOP[F] ADUNIT[] T[]
From Tuesday's close through the end of the week, November soybeans continued to struggle. As the contract drifted Wednesday and Thursday, volume fell off sharply to 126,818 and 101,021 contracts traded respectively. Then on Friday, November soybeans moved to a new weekly low of $13.46 before closing at $13.57 1/2, down 11 cents for the day. Volume ticked up slightly, though it is hard to discern if this was a result of increased buying off the low or occurred throughout the day as the contract came under pressure.
Generally speaking, decreased volume on days when a market closes lower in an uptrend is seen as a bullish technical signal. That's why Friday's slight increase to 108,510 contracts could raise a warning flag that sellers could become more interested participants.
There are a couple more signals of interest on the chart as well. Daily stochastics (second study) show a bearish crossover occurred during Tuesday's peak and lower close. A bearish crossover is established when the faster moving blue line crossing below the slower moving red line, with both above the overbought level of 80%. This signal tends to coincide with a change in trend (note the previous signal was a bullish crossover below the oversold level of 20% established on August 8.
Also notice that the bullish sentiment toward market fundamentals reflected in the November to January futures spread (third study, green line) flagged slightly at the end of the week. After posting a high of a 5 cent carry (again on Tuesday, August 27) the spread closed at a 2 3/4 cent carry Friday. This weakening of the inverse was most likely tied to weather forecasts for a breakdown in the heat that has settled over the U.S. Midwest the last few weeks, allowing scattered rains to move into the area.
Keep in mind that the secondary (intermediate-term, weekly chart) and major (long-term, monthly chart) trends remain up. If the minor (short-term) trend has turned down, initial support is pegged at $13.27 1/4, the 33% (Dow Theory) retracement level of the previous uptrend from $11.62 1/2 (August 7) through last week's high. It is interesting to point out that this would close the price gap between the high of $13.31 1/2 (Friday, August 23) and the low of $13.48 (Monday, August 26).
If the 33% retracement level doesn't hold, November soybeans could pull back to the 50% retracement level of $12.86. Given that the November to January futures spread remains inverted and bullish, albeit weakened, the contract would not be expected to pull back more than 50%.
To track my thoughts on the markets throughout the day, follow me on Twitter: www.twitter.com\DarinNewsom
Comments
To comment, please Log In or Join our Community .