
Technically Speaking
Nov Beans Daily Chart Analysis? Think Twain.

One doesn't have to push their memory too far back to recall when all was doom and gloom in the soybean market. It didn't take much prodding for analysts to come up with a half-dozen or so readily available bearish factors pointing to the demise of the bean market. Less than a week later, soybean market bulls could use Twain's, "The report of my death was an exaggeration."
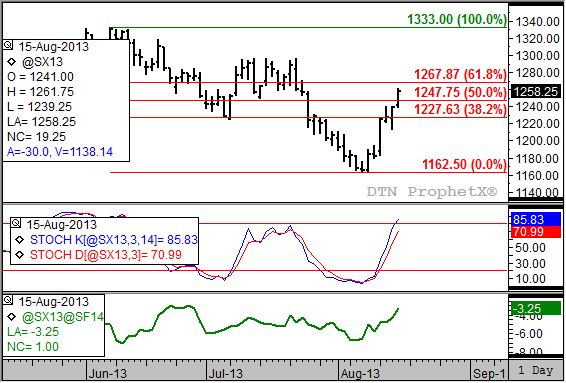
A look at the daily chart for November soybeans shows the mercurial nature of market opinion. Just over a week ago, August 7 to be precise, the contract posted its daily low of $11.62 1/2. By last Friday (August 9) the contract had established a bullish crossover with its daily stochastics (second study), meaning the faster moving blue line had crossed above the slower moving red line with both below the oversold level of 20%. In fact, this occurred on Thursday, August 8 with both in single digits.
Along with the signs of a budding uptrend in the futures contract, the November to January futures spread (third study, green line) had already reestablished its own uptrend meaning the carry was being whittled away indicating the short-term commercial outlook was growing more bullish. Given that the November is now the pricing contract for old-crop as well as the nearby new-crop contract, this commercial support could have stemmed from either market (old or new).
Regardless of cause, the structure of the market was growing more bullish.
P[L1] D[0x0] M[300x250] OOP[F] ADUNIT[] T[]
The dawning of this week saw the contract quickly add to its strength following the release of USDA's August Supply and Demand and Crop Production reports Monday. Truth be told though, the soybean market had already posted a double-digit rally leading into the release of USDA numbers at 11 am (CT). At the close, November beans were near the session high of $12.28.
Note that this was a test of the 38.2% retracement level of the previous downtrend from $13.33 through the low of $11.62 1/2 (the high of $13.33 was used because it correlates to the last bearish reversal by stochastics above the 80% level) near $12.27 3/4. However, given the bullish commercial outlook indicated by the weak carry in the November to January spread, the contract would be expected to see at least a 50% retracement to $12.47 3/4, possibly extending to the 61.8% level near $12.67 3/4. Thursday morning has seen the contract post a high of $12.61 3/4 while indicating it is still gaining strength.
Note that daily stochastics are quickly approaching the overbought level of 80% as contract moves toward the 61.8% level. It is possible that the short-term uptrend uncovers renewed selling interest at this price, not only slowing its rally but possibly bringing it to a stop.
As for signals on the secondary (intermediate-term) weekly chart, that will be discussed in Friday's blog.
To track my thoughts on the markets throughout the day, follow me on Twitter: www.twitter.com\DarinNewsom
Commodity trading is very complicated and the risk of loss is substantial. The author does not engage in any commodity trading activity for his own account or for others. The information provided is general, and is NOT a substitute for your own independent business judgment or the advice of a registered Commodity Trading Adviser.
Comments
To comment, please Log In or Join our Community .