

Technically Speaking
Believe or Not, May Beans Showing Signs of Life
To study possible short-term developments in the soybean market, I chose to look at the daily chart for the May contract due to higher open interest than the July and option expiration of May puts and calls at the end of this month. What I found was interesting, because the recent collapse in the contract has actually led to bullish technical signals.
On March 27, the day before USDA's Quarterly Stocks report, May soybeans closed at $14.53 3/4. Early the next day the contract extended its ill-fated rally to a high of $14.59 3/4 before corn hit an iceberg, pulling soybeans down in the undertow. Since then the May bean contract has done a full Leonardo, sinking like a frozen star into the murky depths. However, this past Friday the contract started to show signs of life.
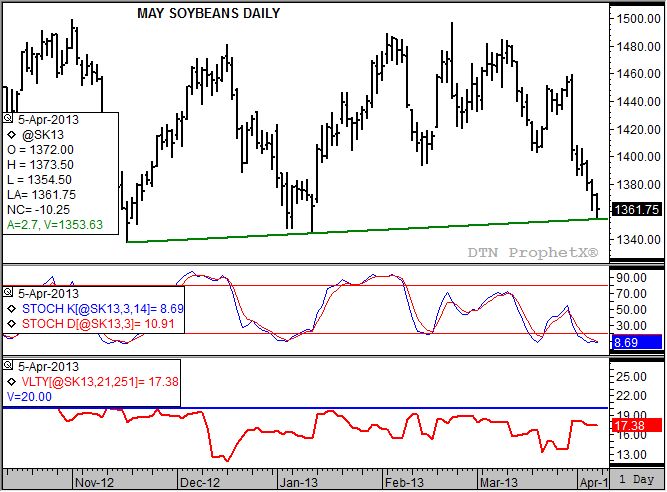
May soybeans posted a low of $13.54 1/2 during the latter half of Friday's session. This low was just above trendline support (green line) near $13.53 1/2 created by connecting the lows of $13.37 3/4 (November 16, 2012) and $13.44 (January 11, 2013). The contract then rallied to finish off the week at $13.61 3/4. While not a huge move, it could be enough to indicate that the contract is beginning to stabilize.
Note that weekly stochastics (second study) is indicating May soybeans are in an oversold position with both the faster moving blue line (8.69%) and slower moving red line (10.91%) below 20%. This sets the stage for a possible bullish crossover - blue line crossing above the red line below 20% - indicating a move to a minor (short-term) uptrend, possibly as soon as early next week. If this occurs, and given the continued bullish outlook indicated by the inverted May to July futures spread (not shown, but closing Friday at 18 cents) the market could see at least a 50% retracement of the previous sell-off from the high of $14.89 1/2 (February 4, 2013) through Friday's low, putting a possible price target near $14.22.
Notice that I didn't use the spike high of $14.97 from February 22, 2013. Instead, I am looking at highs and lows in conjunction with crossovers in daily stochastic, with the last major bearish signal occurring on February 4. Also notice that the last two times the market sold off daily stochastics did not see a bullish crossover below 20%. This would indicate that subsequent rallies would be difficult to maintain as no definitive change in trend was signaled.
That, combined with the test of trendline support, is what makes the recent sell-off different. Unless a spike rally is seen early next week, the likelihood of a bullish crossover by daily stochastics below 20% is stronger, meaning a better chance to see the establishment of a minor uptrend.
The bottom study shows daily volatility (red line) for the May contract. Option traders will note that the 17.38% is near the high end at 20%. This could spark increased interest in selling put options, given the contract's price relationship to trendline support and previous lows. Most attractive to traders could be the $13.40 puts that closed Friday showing a premium of 14 3/8, or the at-the-money $13.60 puts at 22 1/4. With only 20 days until expiration, premium should quickly decay. This is not a recommendation to make such a trade, but an observation as to what actions could provide support to the May soybean contract.
P[L1] D[0x0] M[300x250] OOP[F] ADUNIT[] T[]
To track my thoughts on the markets throughout the day, follow me on Twitter: www.twitter.com\Darin Newsom
Commodity trading is very complicated and the risk of loss is substantial. The author does not engage in any commodity trading activity for his own account or for others. The information provided is general, and is NOT a substitute for your own independent business judgment or the advice of a registered Commodity Trading Adviser.

Comments
To comment, please Log In or Join our Community .