

Technically Speaking
The Interview I Didn't Do

The early part of this week was hectic. Seeing the winter storm that was forecast to move into the Midwest on Tuesday, I had to change my travel plans to and from a speaking engagement with the Illinois Soybean Association on the campus of Illinois State University Monday. Doing so meant flying into St. Louis early Monday morning, then driving to Normal, Illinois to speak at the ISA Soybean Summit (a fantastic crowd, by the way).
While driving across the flatlands of south-central Illinois, I was startled out of my “driver’s daze” by the ringing of my phone. Looking at the number, I could tell that the call was from New York, meaning most likely a reporter asking me about something was going on in the markets that I wasn’t aware of that morning. Instead it was one of the producers from CNBC, asking if I could appear that afternoon to talk about my favorite commodity trade at this time. I replied that unfortunately I was unavailable, and continued on my way to Normal.
But what would I have said if I did go on the air? As I told the crowd later that day in Illinois, my answer is quite simple: my favorite commodity trade, at least for now, remains being long cash soybeans.
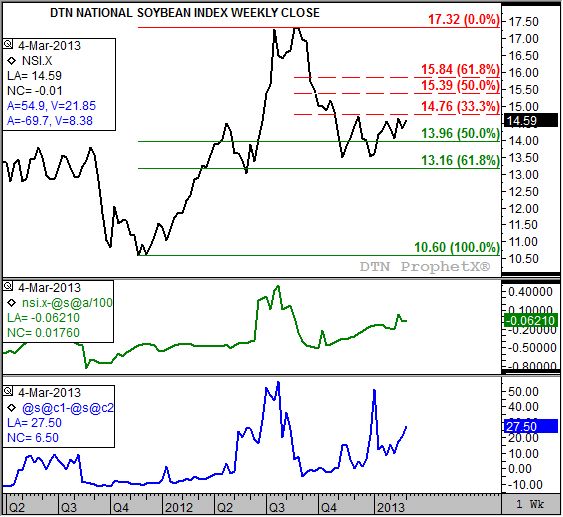
I’m not sure this is what CNBC would have been looking for, but to me the cash soybean market is the most interesting thing going at this time. The DTN National Soybean Index (NSI.X) is slowly building toward a bullish breakout on its weekly close chart (top study, attached chart). To do so the NSI.X needs to see a weekly close above the recent high of $14.69. Notice though that this puts the market (national average cash price) near technical resistance at $14.76, a price that marks the 33% retracement (Dow Theory) of the sell-off from the high of $17.32 (week of August 27, 2012) through the low of $13.48 (week of November 12, 2012). Also note that the recent slow rally was preceded by the establishment of a double-bottom with the secondary low of $13.51 (week of December 31).
Using a simple measuring technique of the distance from the double-bottom to the interim high gives us a price range of $1.19 ($14.69 - $14.50). On a move through the previous high ($14.69), one possible way of establishing the next price target is to add the previous sideways range to the breakout point ($14.69 +$1.19) resulting in a target of $15.88. Another look at the weekly chart shows this to be a test of the 61.8% (Fibonacci) retracement of the previous downtrend.
Why would the cash soybean market post such a solid rally? The answer is simple fundamentals. The second study (green line) is the weekly close chart for national average basis (NSI.X – most active futures). Notice that it too is in a solid uptrend, most recently calculated at 7 cents under the May futures contract. Also, the nearby futures spread (bottom study, blue line) shows another strong uptrend reflecting a strengthening inverse situation. Both signal that the cash market should continue to firm against the futures until a change in trend is seen on concerns over supplies to meet global demand despite the ongoing talk of large South American production.
Seasonally the cash market tends to see a strong rally from mid-March through early July, gaining about 17% over roughly 15 weeks. I should mention that a comparison of the five-year seasonal studies of the NSI.X and the more active soybean futures shows that over the same time frame futures tend to gain 22%, meaning basis tends to weaken during the seasonal rally.
So how could one trade this market? Producers still holding cash can continue to do so, though fully aware that daily price swings will require copious amounts of antacids. Traders not holding the physical commodity could look at buying NSI.X futures traded on Globex. Before diving into that pool though, one needs to know that volume is near nonexistent, so liquidity is an issue. Another way to position oneself in a similar fashion to holding cash would be buying the nearby, most active futures contract. In this case that would be the May, anticipating a possible rolling of the futures position at some point to the July (e.g. sell out of the May position while at the same time buying into the July).
P[L1] D[0x0] M[300x250] OOP[F] ADUNIT[] T[]
The key to any of these trades is to watch for early signs of a change in trend. A topic I have not touched on lately, but will revisit in the future, is the long-term downtrend in the soybean market established last September (blog from September 27, 2012 “Soybeans: A Market on the Edge”). With this still hanging over the market, we need to treat soybeans with caution.
To track my thoughts on the markets throughout the day, follow me on Twitter: www.twitter.com\Darin Newsom
Commodity trading is very complicated and the risk of loss is substantial. The author does not engage in any commodity trading activity for his own account or for others. The information provided is general, and is NOT a substitute for your own independent business judgment or the advice of a registered Commodity Trading Adviser.
Comments
To comment, please Log In or Join our Community .