

Technically Speaking
Long Term Trends in Chicago Wheat

This week’s On the Market column “A Long Winter’s Nap” recaps the outlook for wheat in 2013 that I presented at the DTN/The Progressive Farmer Ag Summit earlier in December.
Wheat is a tricky market with all the different classes potentially showing different signals. In this case, I used the Chicago market as a proxy for all wheat, including Minneapolis spring wheat, to discuss general trends. As time goes on I can focus on specific markets (e.g. Minneapolis, Kansas City, etc.) as technical changes dictate.
P[L1] D[0x0] M[300x250] OOP[F] ADUNIT[] T[]
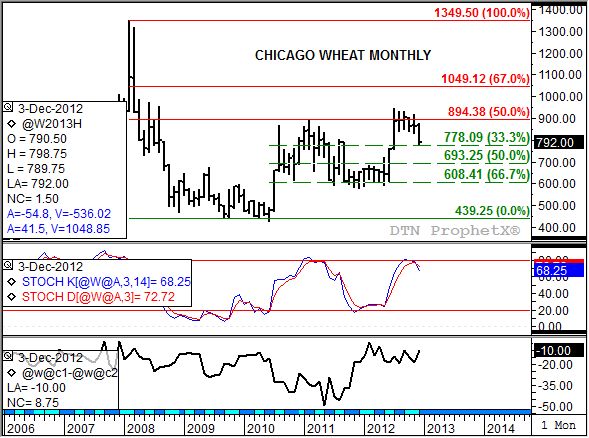
A look at the long-term monthly Chicago wheat chart and accompanying studies shows a seemingly wide array of trend and momentum changes. However, upon closer inspection, the changes really aren’t there. For example, my read on the major (long-term) trend remains up, given the combination of chart signals and monthly stochastics (momentum indicator, second study). The bullish turn goes back to September/October 2009 time frame when the most active contract posted a low of $4.39 1/4. Yes, I know the market posted a lower low of $4.25 1/2 in June 2010, but keep in mind the market’s penchant for head-fakes.
What gives the 2009 low the look of the turning point is the bullish crossover by monthly stochastics below the oversold level of 20%. In June 2010, both the faster moving blue line and slower moving red line stayed above 20%. Also note that the subsequent high of $8.93 1/4 established in February 2011 was not in combination with a bearish crossover above 80%. The crossover occurred the following month with both lines (red and blue) back below 80%. This can be interpreted as the trend is sideways to down rather than strictly down. Also notice that the high ($8.93 1/4) was a test of the 50% retracement level of the previous downtrend from $13.49 1/2 through the previously mentioned low of $4.39 1/4.
After hitting the 2011 high the market fell back to support near $6.00. At that point the market gathered itself for the next leg of the uptrend that extended to the 2012 high of $9.47 1/4 (July 2012) before falling back toward retracement support at $7.78. It should be pointed out that the 2012 high did not see a monthly stochastic crossover above 80%, once again indicating the major uptrend remains in place though the secondary (intermediate-term) trend was sideways to down (also seen on the weekly chart).
As mentioned above, the market could find support at $7.78, the 33% retracement of the ongoing uptrend from $4.39 1/4 through the 2012 high. Now take a look at the trend in the nearby futures spread (bottom study). The trend looks to be sideways to up, meaning a weakening of the carry could continue to be seen indicating a less bearish commercial outlook. However, given that the carry remains near 10 cents the futures market could possibly pull back to support at the 50% retracement level of $6.93 1/4.
Ultimately the market should be able to establish one more leg up before the major uptrend is completed. How high this might be depends a great deal on how bullish the futures spreads become. The nearby spread could test resistance at the February 2012 peak of a 3 3/4 cent carry, pulling the nearby futures contract back to a possible test of the 2012 high.
To track my thoughts on the markets throughout the day, follow me on Twitter: www.twitter.com\DarinNewsom
Comments
To comment, please Log In or Join our Community .