

Fundamentally Speaking
2019's Corn Planting Pace Appears Slowest Ever

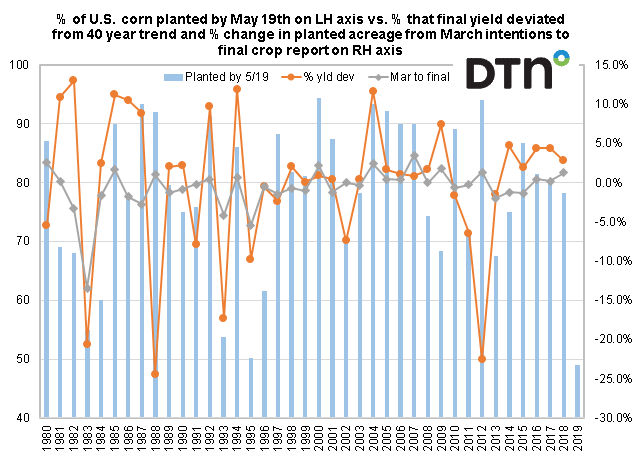
This graph shows the percent of the U.S. corn crop planted by May 19 going back to 1980 on the left hand axis.
For each year, we also show the percent that the final yield deviated from the 1980-2018 trend along with the percent that final plantings deviated from the farmer intention futures given at the end of March.
For reasons we have outlined in prior posts, a lagging pace of corn seedings tends to result in less acreage than given in the end of March prospective plantings report and yields that tend to average below trend.
P[L1] D[0x0] M[300x250] OOP[F] ADUNIT[] T[]
This is based on corn being subjected to hotter summer temperatures during the critical reproductive phase and a greater than normal chance that a large part of the crop will not be mature by the time the normal first fall freeze date arrives let alone an early one.
Additional corn problems include slow emergence due to compacted soils that may need tillage, less input application especially fertilizer as the fall program was compromised by wet autumn weather while side dressing this spring with liquid ammonia stymied by again wet weather and tight supplies due to logistical issues.
The correlation between plantings and deviation from trend yields is only 22% since summer weather (precipitation and temperatures) is still the most important factor but the correlation between seedings complete by May 19 and the change in corn planted area between the March intentions and the final crop production report is a much higher 62%.
The 49% corn planted figure as of May 19 that USDA gave earlier this week is the slowest corn planting pace ever going back to 1980 which is the first time the USDA started assembling planting pace data on a national scale.
The only years that come close are 1995 when 50% was planted with final yields that season 9.8% below trend and final planted acreage 5.4% or 4.08 million acres down from what was indicated in March, 1993 when 54% was in the ground with yields 17.4% below trend and acreage down 4.1% or 3.163 million off, and 1983 when yields were 20.1% below trend and acreage off 13.5% or 9.38 million acres off from farmer intentions.
Thus the fuss about late plantings seems very justified as these yield and acreage deviations applied to this year's crop could make what had been looking like a very large carryout situation into something much tighter, and perhaps much more alarming.
(KA)
Comments
To comment, please Log In or Join our Community .