
Canada Markets
USDA's March Reports and the Canola Market
The USDA will release two reports on March 31 that have proved to be market movers in the past. The first is the Quarterly Stocks report as of March 1, which signals the effect of demand on estimated supplies and provides insight into the direction of ending stocks for the crop year which in turn becomes beginning stocks for the next crop year.
Second is the Prospective Planting report, providing an initial look into intended acres of U.S. crops to be planted. DTN analysis shows that there has been four double-digit moves in the December corn price with the release of the March reports over the past five years, while three double-digit moves in November soybeans during the same period.
P[L1] D[0x0] M[300x250] OOP[F] ADUNIT[] T[]
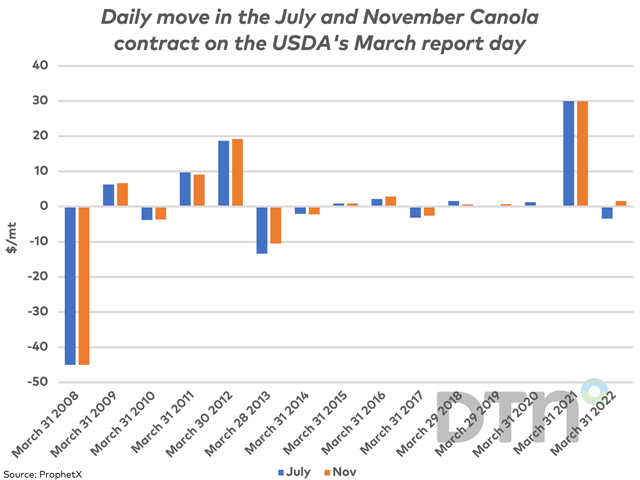
The attached chart shows how the March USDA reports have spilled over into the old-crop and new-crop canola trade during the past 15 years. As is seen with the blue bars (July contract) and brown bars (November contract), the moves have been similar, with old-crop and new-crop futures moving in the same direction in 13 of the 15 years.
Both the July and November contracts close higher on the day of the USDA reports in nine of the 15 years, a move averaging $7.87/metric ton for the July contract and $7.97/mt for the November contract. As is seen on the chart, large moves are uncommon, with large daily moves seen in three of the 15 years. This includes an $18.70/mt rally in the July and $19.20/mt rally in the November contracts in 2012, while both old-crop and new-crop contracts posted a daily limit move higher of $30/mt in 2021.
Both old-crop and new-crop canola closed lower on report day in six of the past 15 years, averaging $11.82/mt lower for the July contract and a $10.70/mt drop for the November contract. The largest move over this period is seen in 2008, when both the July and November contracts settled lower by an amount equal to the daily limit of $45/mt.
While the odds of a major move in the canola price seem low, the potential for a large move does exist as the oilseed trade adjusts to the implications resulting from the fresh data.
Cliff Jamieson can be reached at cliff.jamieson@dtn.com
Follow him on Twitter @Cliff Jamieson
(c) Copyright 2023 DTN, LLC. All rights reserved.

Comments
To comment, please Log In or Join our Community .