

Canada Markets
Cumulative Grain Deliveries as of Week 32
Just ahead of spring conditions -- road bans or weight restrictions along with a shift in focus to spring seeding, producers delivered 1.3405 million metric tons (mmt) of the principal field crops into the licensed handing system in week 32, or the week ending March 12. This is down slightly from the previous week and compares to the four-week average of 1.2857 mmt.
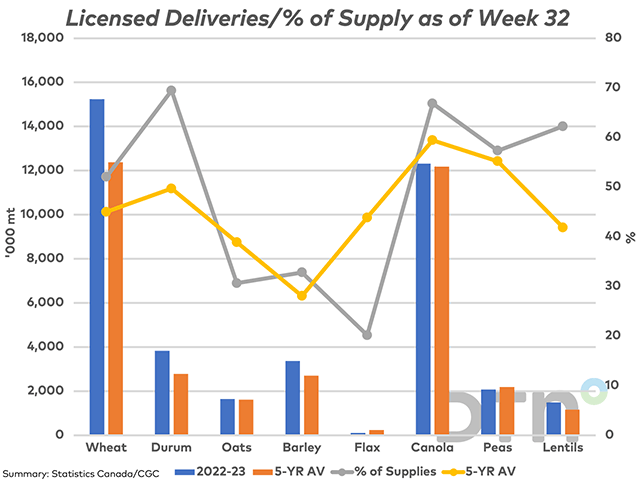
Cumulative deliveries at 41.6463 mmt are up 35.9% from last year and 12.5% higher than the five-year average. Of the crops shown on the attached graphic, deliveries of all crops shown are above the average pace except for flax, down 57.6%, and dry peas, down 5.1% from the average volume.
Of the six crops shown where deliveries are above average, wheat deliveries up 23.1%, durum deliveries are up 37.5% and lentil deliveries are up 28.4% from the average volume.
P[L1] D[0x0] M[300x250] OOP[F] ADUNIT[] T[]
The lines on the attached chart represents the grain delivered as a percent of the grain available for delivery, based on current Statistics Canada and Canadian Grain Commission estimates. In other words, it is the cumulative week 32 deliveries divided by the July 31, 2022 farm stocks added to the estimated 2022 production estimate.
Based on current estimates, this provides insight into how tight grain supplies are as of week 32 based on current estimates, while may signal that stocks may be tightening fast or there is more grain available than what is seen in current government estimates.
The highest percentage calculated is for durum, with the current calculation indicating that 69.3% of the durum has been delivered over the first 32 weeks (grey line), while the five-year average for this week is 49.7%. The percentage for canola is also high at 66.9% or two-thirds of available supplies, which compares to the five-year average of 59.4%.
A calculated 20.3% of the flax has been delivered due to competitive challenges in the global market and lack of exports, which is below the 44.1% calculated on average over five years.
Cliff Jamieson can be reached at cliff.jamieson@dtn.com
Follow him on Twitter @Cliff Jamieson
(c) Copyright 2023 DTN, LLC. All rights reserved.

Comments
To comment, please Log In or Join our Community .