

Canada Markets
January Canola on a Wild Ride
It takes nerves of steel to watch prices at multi-year highs, wondering where we go from here? Recent discussions among DTN analysts have pointed to the challenge in picking tops when compared to bottoms. The other factor hanging over all the grains is the massive net-long futures position held by speculative traders, along with the notion that markets remain vulnerable to a sudden sell-off as a result.
Wednesday's January canola trade was a good example of what can go wrong.
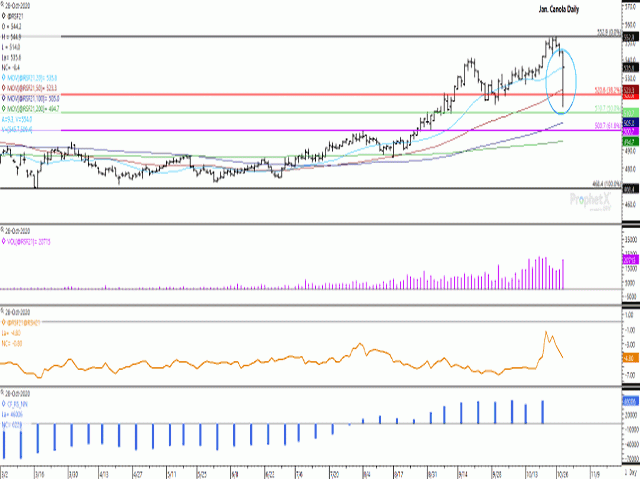
January canola traded $30/metric ton lower overnight to reach a low of $514/mt, only to recoup $21.60/mt of this loss to end down $8.40/mt at $535.60/mt. This move saw a breach of the 20-day moving average, the 50-day moving average and the 38.2% retirement of the move from the contract's March low to the October high that is calculated at $520.60/mt, while the close ended just $0.20/mt below the contract's 20-day moving average calculated at $535.80/mt. Today's range of $30.90/mt is highlighted within the ellipse drawn on the attached chart.
P[L1] D[0x0] M[300x250] OOP[F] ADUNIT[] T[]
What is interesting is that while there was significant volume traded overnight, over 3,000 contracts in the January contract that led to the sharp move, the daily volume of 20,715 contracts for the January contract was only the highest volume traded in five days. Stops were clearly triggered as various levels of technical support were breached.
The blue bars on the lower histogram shows the noncommercial net-long position at 46,006 contracts as of Oct. 20, the second-highest on record. Records have only been kept for canola since August 2018. What may be far more influential for prices is the most recent noncommercial net-long position in soybeans, the largest since July 2012, when traders were influenced by drought conditions.
So far this week, the January contract has shed $15.40/mt. Since the contract low reached in March, there has been five corrections that ranged from $6/mt to $19.20/mt, averaging $12.58/mt.
The brown line on the second study of this chart reflects the weakening Jan/March futures spread, which has moved from minus $1.30/mt on Oct. 21 to minus $4.80/mt as of Oct. 28. This reflects roughly 39% of full commercial carry and reflects a neutral carry and view of market fundamentals.
While not shown, the continuous active monthly chart is poised to show a fifth consecutive higher close this month, having reached its highest level in more than seven years. This is the longest stretch of gains seen on this chart since 2010, while the current close is near the middle of the month's range.
One chart signal that does bear watching is a bearish outside-bar formed on the weekly chart (not shown). This week's trade in the January contract has traded both higher and lower than last week's range, while the signal can only be confirmed with a loss for the week on the weekly chart, which seems probable at this time. This chart also shows a five-week low reached this week, which is further confirmation of a reversal.
Cliff Jamieson can be reached at cliff.jamieson@dtn.com
Follow him on Twitter @Cliff Jamieson
(c) Copyright 2020 DTN, LLC. All rights reserved.
Comments
To comment, please Log In or Join our Community .