Canada Markets
Spring Wheat Futures Face Technical Challenges
United States wheat stocks estimated for Sept. 1 were reported only slightly below expectations, viewed as neutral overall. As well, today's September production estimates were close to the average of pre-report estimates and to the USDA's previous estimate, also viewed as neutral.
The mildly bullish nuggets to come out of today's wheat data was both hard red winter wheat and soft red winter wheat production estimates that were below the USDA's previous estimates, as well as the average of pre-report estimates.
Estimates for the other spring category can be viewed as bearish in today's report, 9 million bushels higher than the previous estimate and 8 mb higher than the average of pre-report estimates at 586 mb. The estimate for hard red spring wheat at 530.152 mb is close to unchanged from the previous estimate.
The Sept. 30 wheat rally was led by winter wheat futures, with the December SRW reaching its highest trade since January and the December HRW contract reaching its highest level since April, while both closed above all major moving averages.
P[L1] D[0x0] M[300x250] OOP[F] ADUNIT[] T[]
While there was nothing bullish about the U.S. spring wheat data, prices did go along for the ride on Sept. 30, while the December contract may face a challenge in sustaining a continued move higher without supportive data.
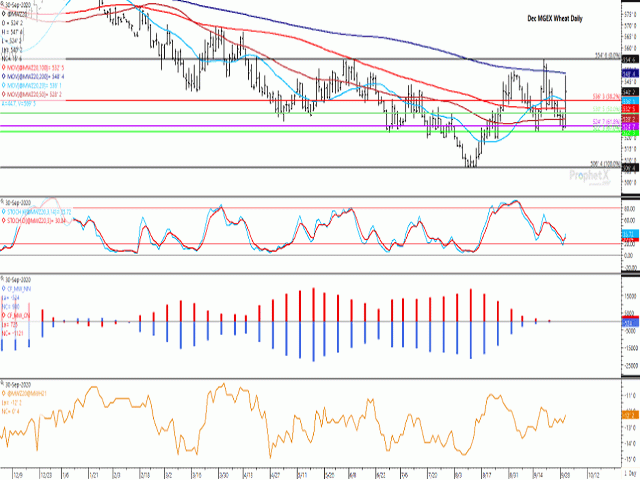
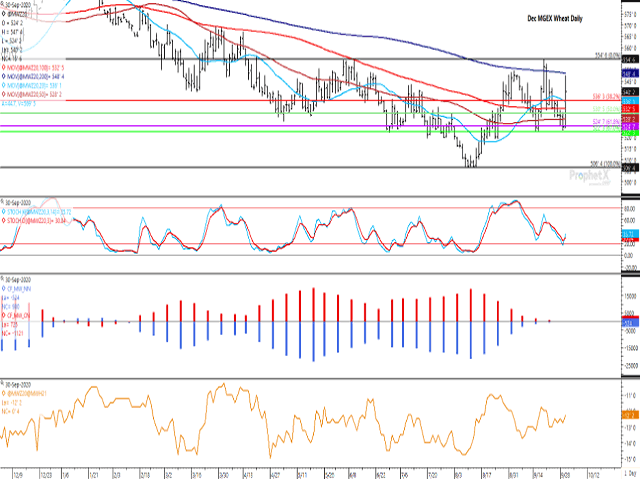
As seen on the attached chart, resistance lies above at the contract's 200-day moving average at $5.48 1/2 per bushel (bu), along with the September high of $5.54 3/4/bu. On Sept. 18, the December contract closed above its 200-day moving average for the first time since Jan. 23, while the move was met with a double-digit move lower the following day.
The first study shows momentum indicators crossing and turning higher, although is not the most bullish of turns, which are reserved for a cross-over that takes place in oversold territory of the chart or below the 20% line.
The second study of the attached chart shows commercial traders reducing their bullish net-long position (red bars) while noncommercial traders have reduced their bearish net-short position (blue bars) over a six-week period. Both sides of the trade have been seen moving towards a neutral futures position, with a net-long of 725 contracts held on the commercial side and a net-short of 524 contracts as of Sept. 22. Both sides are showing extreme caution and not heavily invested in a market move in one direction or the other.
One possible scenario, given today's price action, is that today's trading bar is the start of a right shoulder of a head and shoulders chart pattern, with a failure to breach the 200-day moving average, leading to eventual selling pressure. A breach of the neckline at $5.22 to $5.23/bu could lead to further bearish pressure.
**
DTN 360 Poll
This week's poll asks what you think of the most recent Statistics Canada model-based production estimates. You can weigh in with your thoughts on this topic on the poll, found on the lower-right side of your DTN Home Page. We thank you for your input.
Cliff Jamieson can be reached at cliff.jamieson@dtn.com
Follow him on Twitter @Cliff Jamieson
© (c) Copyright 2020 DTN, LLC. All rights reserved.


Comments
To comment, please Log In or Join our Community .