
Technically Speaking
Weekly Analysis: Livestock Markets

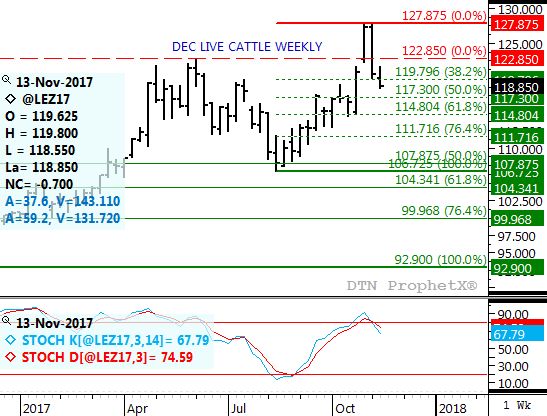
Live Cattle: The December contract closed $1.725 lower at $118.85. The contract's secondary (intermediate-term) trend remains down with next support at $117.30. This price marks the 50% retracement level of the previous uptrend from $106.725 through the high of $128.875. Given the bearishness of the December-to-March futures spread the contract could extend its sell-off to the 61.8% retracement mark of $114.80 and possibly the 76.4% level near $111.725. Weekly stochastics are bearish and still near the overbought level of 80%.
P[L1] D[0x0] M[300x250] OOP[F] ADUNIT[] T[]
Feeder Cattle: The more active January contract closed $5.45 lower at $151.725. The contract remains in a secondary (intermediate-term) downtrend. Initial support is near $150.95, a price that marks the 23.6% retracement level of the previous uptrend from $114.95 through the recent high of $162.075. The 38.2% retracement level is $144.075 with the 50% mark near $138.50. Weekly stochastics are bearish and still near the overbought level of 80%.
Lean Hogs: The December contract closed $1.825 lower at $60.65. The contract's secondary (intermediate-term) trend remains sideways-to-down, with initial support this week at the 4-week low (last week's low) of $59.25. The contract is showing a wide range between $55.775 and $65.675, discounting the spike high to $68.175 the week of October 30.
Corn (Cash): The DTN National Corn Index (NCI.X, national average cash price) closed at $3.05 3/4, up 2 cents for the week. For now the secondary (intermediate-term) trend could still be considered sideways. The NCI.X needs to see a weekly close above its previous high weekly close of $3.08 1/2 to indicate a move into a normal seasonal uptrend that tends to last through early June. Support is at a weekly close of $3.00.
Soybean meal: The December contract closed $3.70 higher at $318.20. The contract remains in secondary (intermediate-term) and major (long-term) sideways trends. Support this month on the long-term monthly chart is calculated at $309.20 while resistance is at $346.20.
To track my thoughts on the markets throughout the day, follow me on Twitter: www.twitter.com\DarinNewsom


Comments
To comment, please Log In or Join our Community .