
Technically Speaking
The Dollar's Down Signals
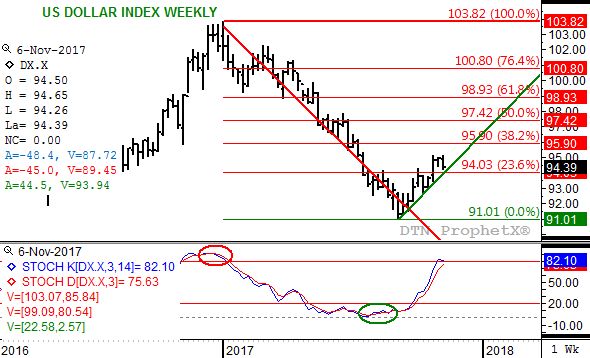
In an interesting turn of events, the U.S. dollar index (USDX) posted a bearish outside week, indicating its secondary (intermediate-term) trend may have turned down. If so, the USDX would have fallen short of its upside target at 95.90, the 38.2% retracement level of the previous secondary downtrend from 103.82 through the low of 91.01.
Notice that last week's trading range of 95.15 to 94.26 was outside the previous week's range of 95.02 to 94.41 before the USDX closed lower for the week. Also, last week's high equaled the peak from two weeks ago. The combination of these two patterns, a bearish outside week and double-top, indicate the USDX could start to gain downside momentum.
That's where the technical indicators get interesting, because in my studies I watch momentum by using stochastics (bottom study). Notice that weekly stochastics for the USDX did not climb above the overbought level of 80% before establishing bearish technical patterns. On its own, stochastics would suggest the USDX has more room to rally, again setting the stage for a test of the 95.90 mark.
Key to what might happen could lie with how the USDX reacts to a test of trendline support (green line), the Gann 45* line from the secondary low of 91.01. If the USDX finds renewed buying interest near this line, last week's technical patterns could be nullified. On the other hand, if this trendline support fails to hold the USDX could quickly extend it newly established downtrend.
To track my thoughts on the markets throughout the day, follow me on Twitter:www.twitter.com\Darin Newsom
P[L1] D[0x0] M[300x250] OOP[F] ADUNIT[] T[]

Comments
To comment, please Log In or Join our Community .