
Technically Speaking
Sugar May Be a Little Too Sweet

It's hard to believe that sugar could post a major (long-term) top in October, the month when more candy is bought and handed out to costumed strangers at the door. But unless the futures market's monthly chart is playing a trick on us, subsequent months may be no treat for market bulls.
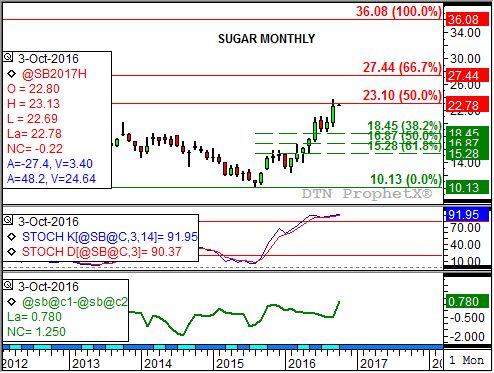
Take a look at the attached chart. Note that the September high for sugar was 23.60 (cents per pound), slightly above retracement resistance at 23.10. This price marks the 50% level of the previous downtrend from 36.08 (February 2011) through the low of 10.13 (August 2015). However, the nearby (and most active) March contract slipped to close the month at 22.53.
P[L1] D[0x0] M[300x250] OOP[F] ADUNIT[] T[]
By itself, this probably wouldn't be enough to turn the long-term trend. Given the continued strength of the nearby futures spread (green line, bottom study) the market could be projected to extend its major uptrend to the 67% retracement level of 27.44. However, the market is sharply overbought with monthly stochastics (middle study) near 90%. Recall that a market with a stochastics reading of 80% (top red line, same study) is considered overbought.
Let's apply standard DTN analysis to the sugar market: First, the trend remains up reflecting continued noncommercial (investment) buying. Last Friday's CFTC Commitments of Traders report confirmed this factor, report noncommercial traders increasing their net-long futures position by 2,367 contracts to a record large 329,296 contracts. This raises the question, who's left to buy the market?
As stated above, the commercial side remains bullish as well. How do we know this? By looking at the trend of the nearby futures spread. The March-to-May spread is priced at 0.82, its strongest inverse since March 2012.
Given that both futures and futures spreads are trending up, sugar would be classified as a Type 1 market on DTN's list of 9 market types. The usual approach to Type 1 market is to continue to hold long cash or futures. So why would I suggest the market may be approaching a top? Because nothing goes up forever.
Remember that the March futures contract is testing resistance at 23.10 while monthly stochastics have moved about as high as they can. While no sell signal has been established yet, the market needs to be watched closely for a topping pattern. According to the market's 10-year seasonal index (not shown) this normally doesn't happen until late January, but action thus far in 2016 has been anything but normal.
To track my thoughts on the markets throughout the day, follow me on Twitter: www.twitter.com\DarinNewsom
Comments
To comment, please Log In or Join our Community .