
Technically Speaking
Weekly Analysis: Livestock Markets
Live Cattle: The June contract closed $5.80 higher at $120.725. Live cattle remain difficult to analyze technically, with the most prominent feature being increasingly high market volatility (calculated at 21.7% at last week's close). Weekly stochastics would indicate that the secondary (intermediate-term) trend is sideways, though June live is coming off a recent fresh contract low of $113.90 posted the week of April 18.
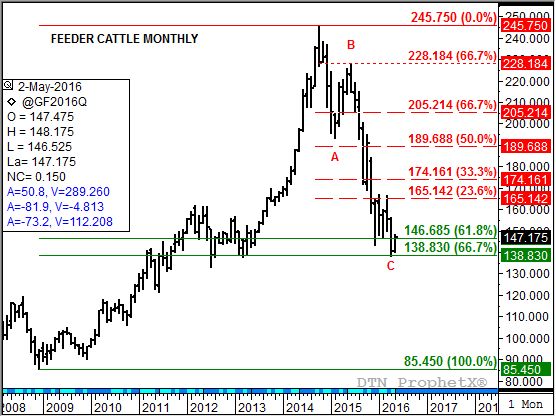
Feeder Cattle: The August contract closed $6.80 higher at $147.175. Similar to live cattle, the feeder cattle market is a difficult read on weekly charts. August posted a new contract low of $138.10 the week of April 26 leading to a recovery rally this past week. Weekly stochastics continue to indicate the market is in a secondary (intermediate-term) sideways trend. However, the market's major (long-term) trend could still be turning up according to its monthly chart. Indications are, at least for now, the April low could be the end of Wave C, or the third wave down in an Elliott 3-Wave downtrend.
P[L1] D[0x0] M[300x250] OOP[F] ADUNIT[] T[]
Lean hogs: The June contract closed $0.425 lower at $81.275 last week. Despite the recent consolidation the secondary (intermediate-term) trend remains down. Resistance remains at the contract high of $83.975 with support between $79.40 and $77.10. These prices mark the 33% and 50% retracement levels of the previous uptrend from $70.25 through the high of $83.975. The 67% retracement level is down near $74.825.
Corn (Cash): The DTN National Corn Index (NCI.X, national average cash price) closed at $3.43, down 13 3/4 cents for the week. The secondary (intermediate-term) trend is sideways, though weekly technical indicators remain a complicated mix. For now resistance remains near $3.59 1/2 while support is near $3.23. The NCI.X most recently tested resistance with a spike high of $3.64 1/4 the week of April 18. The next move could be a test of support.
Soybean meal: The July contract closed $8.00 higher at $342.80. The secondary (intermediate-term) uptrend continues to strengthen. Initial major (long-term) resistance on the market's monthly chart is at $353.10. Last week saw the July contract post a high of $353.40. With weekly stochastics moving above the overbought level of 80%, this could lead to a possible pullback in the market. Friday's weekly CFTC Commitments of Traders report* showed noncommercial interests adding another 9,835 contracts to their net-long futures position.
*The weekly Commitments of Traders report showed positions held as of Tuesday, May 3.
To track my thoughts on the markets throughout the day, follow me on Twitter: www.twitter.com\DarinNewsom


Comments
To comment, please Log In or Join our Community .