

Technically Speaking
A Red Flag Warning in May Corn
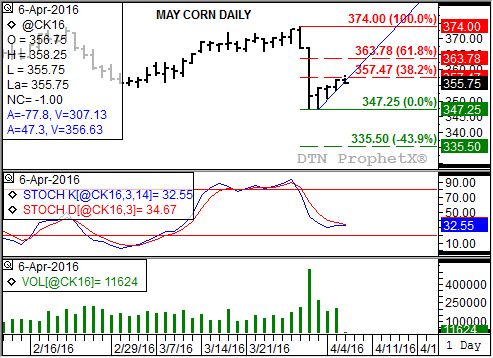
After posting a new contract low of $3.47 1/4 on Friday, April 1, May corn has closed higher three consecutive days. This type of move isn't unusual, recall the old market adage of "three days (weeks, months, etc.) against the trend", but it also doesn't signal the contract's minor (short-term) trend has turned up.
Take a look at the daily chart for May corn. The contract has extended its rally from its new low to a Tuesday evening/Wednesday morning overnight session high of $3.58 1/4 before pulling back. Note that this high was a test of resistance near $3.57 1/2, a price that marks the 38.2% retracement level of the initial sell-off from $3.74 (March 30 high) through the $3.47 1/4 low.
There are a number of things to sort through here. First, the three-day consolidation pattern of higher lows and higher highs could be used as a bearish flag. That being the case a break of the trendline connecting the lows of this pattern (blue line) would be expected to trigger the next sell-off, or second half of the flagpole. Remember the technical saying "flags and pennants fly at half-mast".
This trendline support is calculated near $3.56 3/4 Wednesday. The first half of the flag pole measured 21 1/4 cents, the distance from the bearish breakout at $3.68 1/2 through the new contract low. Note that the initial bearish breakout occurred when May corn posted a reversal on March 30, trading outside the range of March 29 (with the low of $3.68 1/2), a day before the bearish reaction to USDA's March 31 Quarterly Stocks report. Subtracting that distance from the next bearish breakout of the consolidation pattern (e.g. $3.56 3/4) gives us a downside target for the second half of the flagpole of $3.35 1/2.
Such a move would also complete a standard 3-Wave downtrend (Elliott Wave Theory) with Wave 1 being the initial sell-off, Wave 2 the consolidation phase, and Wave 3 the lower half of the flagpole.
Lastly, take a look at daily stochastics (middle study). This short-term momentum study is stuck in between the overbought level of 80% and oversold line of 20%. Its latest minor signal was a bearish crossover (faster moving blue line crossing below the slower moving red line) above the 80% mark at the close of the March 23 session. The next leg down should take daily stochastics below the oversold level of 20%, setting the stage for a possible bullish crossover that would signal the beginning of a new minor uptrend.
To track my thoughts on the markets throughout the day, follow me on Twitter:www.twitter.com\Darin Newsom
P[L1] D[0x0] M[300x250] OOP[F] ADUNIT[] T[]

Comments
To comment, please Log In or Join our Community .