

Technically Speaking
The End of the Death March in Commodities

History books will show that the early trail followed by commodity sector bulls was all that severe, giving little indication of the hardships to come. After peaking in April 2011 the sector started to break in May that would last into early October. And except for a foreboding spike down in June 2012, commodities seemed to settle into a sideways pattern, walking tentatively along the cliff's edge until the footing gave way in July 2014. The trail got much steeper then with only occasional footholds found for support.
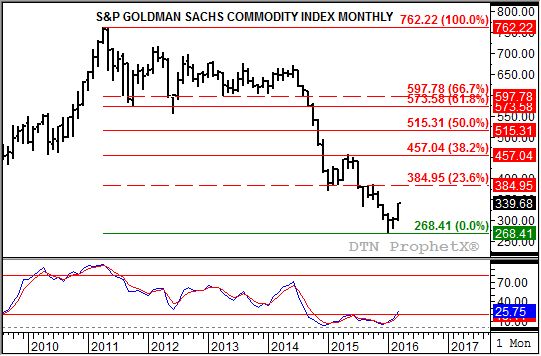
A dramatic tale, isn't it? But take a look at the monthly chart for the S&P Goldman Sachs Commodity Index (SPGSCI.X) and you'll see what I'm talking about. Note that the index posted a high of 762.22 in April 2011, closing near that high at 758.79. May saw the storm clouds of selling start to gather, eventually pushing the SPGSCI.X to a low of 572.92 by October 2011.
P[L1] D[0x0] M[300x250] OOP[F] ADUNIT[] T[]
As we all know, commodities moved into freefall in October 2014 with the SPGSCI.X moving below its October 2011 low. This move didn't take a pause until January 2015 when the index posted a low of 372.16 before closing at 389.68. The following month saw a follow-through rally, establishing a bullish crossover by monthly stochastics (long-term momentum study, bottom chart). A bullish crossover occurs when the faster moving blue line crosses above the slower moving red line, and when this happens with both below the oversold level of 20% usually indicates a major (long-term) change in trend is near.
Except, it wasn't. After a secondary (intermediate-term) rally took the index to a high of 458.68 in May 2015, renewed selling emerged starting the next leg of the sell-off the following July. The renewed downtrend would last until this past January when a new low of 268.41 was established before a strong rally saw the SPGSCI.X close at 300.67. This created a major bullish spike reversal on the monthly chart that coincided with yet another bullish crossover by monthly stochastics, this time below the 10% level.
Technically then, commodities now look to be in a long-term uptrend with initial resistance pegged at 384.95. This price marks the 23.6% retracement level of the previous downtrend, and also marks a series of monthly highs from August 2015 through October 2015.
Commodity sector bulls have been fooled before, and many of the key markets remain bogged down by bearish fundamentals. The SPGSCI.X is a weighted index, with crude oil alone making up almost 41% of its value. The energy complex as a whole comes in at almost 79%. Given the continued bearishness of crude's global supply and demand, it may be hard for many to get excited about this round of bullish technical signals.
But the chart shows what it shows, meaning the index should climb to its initial resistance level if not the 38.2% retracement mark of 457.04. Again note that this held the previous attempted rally from January 2015 through May 2015.
So what's it all mean? The bottom line is that key commodities, most notably crude oil, look to have turned the corner to major uptrend, bringing to an end the downtrend that began back in early 2011. I'll be writing about many of these markets (corn, soybeans, wheat, crude oil, gold, etc.) in an upcoming Newsom On the Market column on DTN.
To track my thoughts on the markets throughout the day, follow me on Twitter:www.twitter.com\Darin Newsom
Comments
To comment, please Log In or Join our Community .