

Technically Speaking
What About Wheat's Monthly Chart?

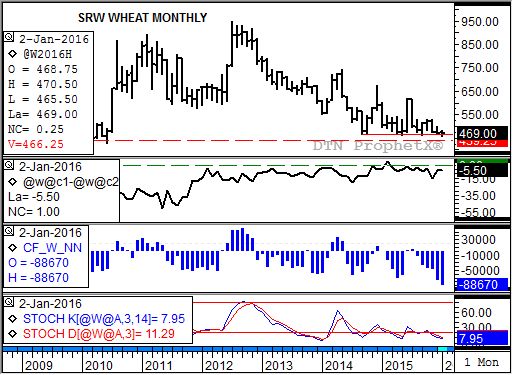
As discussed in my On the Market column for Friday, January 15, the wheat complex in general has no reason to rally. The latest round of USDA numbers, including increases in both domestic and global ending stocks, were viewed as bearish generally across the board. Chicago wheat's long-term monthly chart shows a market on the brink of seeing another sell-off, unless of course it rallies. But more on that later.
Recall that wheat likes to send false technical signals. Why? I don't know; it's just one of its quirky characteristics. The low from September 2014 of $4.66 1/4 continues to hold, kind of. Yes the more active contract has dipped below this level four times since, the most recent being earlier this month, but has yet to close below on the monthly chart. Meanwhile, noncommercial traders continue to build their net-short futures position (third study, blue histogram) as a result of increasing global ending stocks (not shown, but as an example the January WASDE estimated world wheat ending stocks at 232.0 mmt as compared to December's 212.8 mmt).
P[L1] D[0x0] M[300x250] OOP[F] ADUNIT[] T[]
Oddly enough, it's this noncommercial bearishness that could ultimately prove to be bullish wheat, at least for the short or intermediate-term. The most recent (as of this writing) weekly CFTC Commitments of Traders report showed noncommercial interests holding a net-short futures position of 88,670 contracts. When I expanded the monthly chart, this was the largest net-short futures position I could find. If for some reason this group decides to cover some of their short positions, it could lead to a possible minor (short-term, daily charts) or secondary (intermediate-term, weekly charts) uptrend.
Also note that monthly stochastics (bottom study) are well below the oversold level of 20%. This could also be viewed as bullish, though as you can see, much of the last 2 1/2 years have been spent below 20% as the futures market continues to grind lower.
As far as possible developments, the most interesting would be if, somehow, the March Chicago contract is able to climb above the December high of $4.99 and close higher for the month (Dec settlement was $4.70). This would establish a key bullish reversal, given March Chicago posted a new low of $4.56 so far in January, that would most likely trigger a bullish crossover by monthly stochastics. In most markets this combination is a clear signal of a change in long-term trend.
But we're talking about wheat, and again I'll remind you of the joy the complex seems to take in faking traders out.
To track my thoughts on the markets throughout the day, follow me on Twitter:www.twitter.com\Darin Newsom
Comments
To comment, please Log In or Join our Community .