
Technically Speaking
Corn's Long-term Monthly Chart
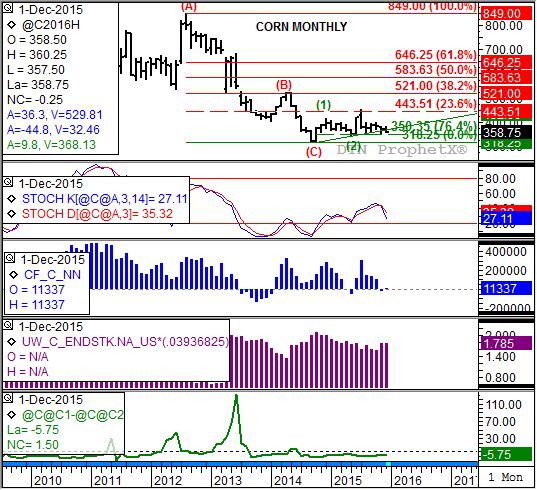
For those of you who can see the attached long-term monthly corn futures chart (I don't think it made it to the satellite systems), there's a lot of information as 2015 comes to an end. However, most of it simply confirms the major (long-term) sideways trend the market finds itself in.
At the top is the price chart itself. The close of $3.58 3/4 by the nearby March contract keeps the market above technical support near $3.50 1/4, a price that marks the 76.4% retracement level of the previous rally from $3.18 1/4 (October 2014 low) through $4.54 1/4 (July 2015 high). It was during July that the market lost its bullish momentum, closing at $3.81 1/4 after falling to a low of $3.75 3/4. Since then the market has slowly been grinding sideways to lower with weekly trading ranges growing tighter.
P[L1] D[0x0] M[300x250] OOP[F] ADUNIT[] T[]
The second study, monthly stochastics, confirms this loss of momentum. After establishing bullish crossovers (the faster moving blue line crossing above the slower moving red line) below the oversold level of 20% at the end of January 2014 and October 2014, momentum seemed to be in favor of a major uptrend. As mentioned above, this played out through early July as the futures market rallied and stochastics grew more bullish. However, it wouldn't last with stochastics finally turning neutral-to-bearish at the end of November with a bearish crossover well below the overbought level of 80%.
Much of the pressure since July has come from noncommercial (investment) traders, as reflected in monthly numbers pulled from weekly CFTC Commitments of Traders reports (third study, blue histogram). In July this group held a net-long futures position of 305,681 contracts. By the end of November the position had been flipped to a net-short of 20,047 contracts. Much of the selling by this group was tied to monthly increases in USDA's estimated domestic ending stocks (fourth study, purple histogram), climbing from 1.599 billion bushels in July to 1.785 bb in its December report.
The commercial side of the market hasn't been quite as bearish, with the nearby futures spread (bottom study, green line) trending sideways-to-up. After closing July at a carry of 10 1/4 cents, the nearby spread has slowly eroded to a carry of 5 3/4 cents at the end of December. Generally speaking, the weaker the carry in the nearby futures spread the more bullish the commercial view of short-term supply and demand. Measured on a scale of full commercial carry (total storage and interest costs of holding the cash commodity in a commercial facility) the 5 3/4-cent carry in the nearby March-to-May futures spread covers roughly 49% of total cost of carry. A simple weigh of breaking this down is 33% or less is considered bullish, 67% or more considered bearish, and everything in between varying degrees of neutral. At almost 50%, the commercial view is nearly dead neutral.
So where should the corn market go from here? For now the neutral structure of corn would suggest a continued sideways pattern. But if noncommercial traders move to a net-short futures position it could put increased pressure on futures. However, it also sets the stage for a possible short-covering rally this coming spring.
To track my thoughts on the markets throughout the day, follow me on Twitter:www.twitter.com\Darin Newsom

Comments
To comment, please Log In or Join our Community .