

Technically Speaking
Surfing Feeder Cattle

I had a question come in via email over the weekend: "How do you see the Elliott Wave count on the weekly continuous feeder cattle chart, from the $245 high to where we are now?" It's a great question with the analytical answer possibly, maybe, finally providing a glimmer of hope to this particular beleaguered market.
First, I pulled up feeder's continuous weekly chart. If you hold your eyes just right you can see what could be a 5-wave uptrend from the low of $149.275 (week of February 2, 2015) through the high of $227.80 (week of June 8). However, I want you to note that I did not start with the $245.20 high (week of October 6, 2014). Why? Because the secondary (intermediate-term) 3-wave downtrend that followed that high actually ended the week of the $149.275 low. The secondary 3-wave downtrend the market finds itself in now started this past June.
P[L1] D[0x0] M[300x250] OOP[F] ADUNIT[] T[]
Analyzing the most current downtrend also requires less than 20/20 eyesight. WaveA could have ended with the low of $208.075 (week of July 20) leading to a WaveB rally back to $216 (week of August 10). The 38.2% retracement level of WaveA was calculated near $215.60. In this analysis WaveC would have bottomed at the low of $174.65 (week of September 28). As we all know though, it didn't. After rallying to a high of $196.30 (week of October 19) the market extended its downtrend to a new low of $147.75 last week.
In order to make this downtrend fit 3-wave analysis we need to overlook the initial rally from late July through mid-August, allowing WaveA to extend to the $174.65 low. This makes the high of $196.30, a test of the 38.2% retracement level calculated near $194.95, the WaveB peak and last week's low the possible WaveC bottom. This analysis also fits better with weekly stochastics that are nearing a secondary (confirming) bullish crossover below the oversold level of 20%, with the initial bullish crossover occurring in conjunction with the now Wave 1 low of $174.65.
The problem with this analysis is that the market has shown no sign WaveC has actually come to an end. Last week's rally off its new low (the January contract closed at $152.125) was about mid-range, while Friday's CFTC Commitments of Traders report showed noncommercial traders added 1,523 contracts to their net-long futures position (as of the week ending Tuesday, December 8).
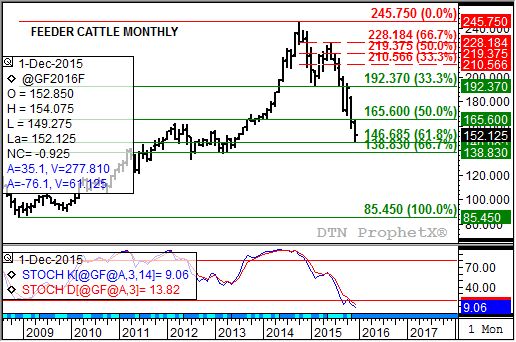
Given we are dealing with a new long-term low it is simpler to analyze feeder cattle on its monthly chart (attached). Here we see a much cleaner 3-Wave downtrend possibly nearing its end.
This analysis uses the $245.75 high from October as its starting point, coinciding with a bearish crossover by monthly stochastics (bottom study). WaveA lasted through the February 2015 low of $193.00, a test of the 33% retracement level of the previous major (long-term) uptrend from the December 2008 low of $85.45 through the $245.70 high. WaveB peaked in June 2015 with a high of $227.80, a test of the 67% retracement level of Wave A, leading to the strong WaveC and this month's low $147.75. In regards to this last number: Notice how it is a test of the 61.8% retracement level ($146.685) of the previous major uptrend, with the 67% retracement level pegged near $138.825.
As with the weekly chart, the long-term monthly has not indicated the low is in, but it may be getting close. Monthly stochastics are well below the oversold level of 20% meaning a bullish crossover signaling a change in trend should happen sooner rather than later. It might take the futures market moving into the area between the 61.8% ($146.675) and 67% ($138.325) retracement levels to accomplish this though.
To track my thoughts on the markets throughout the day, follow me on Twitter:www.twitter.com\Darin Newsom
Comments
To comment, please Log In or Join our Community .