
Technically Speaking
Possible Turn in US Dollar Index

It has been a while since I've posted a US dollar index chart, largely due to the fact the index has been consolidating for a number of weeks. But heading into the weekend before US tax deadline day (Monday, April 15), I thought it in some way appropriate to take another look at recent developments.
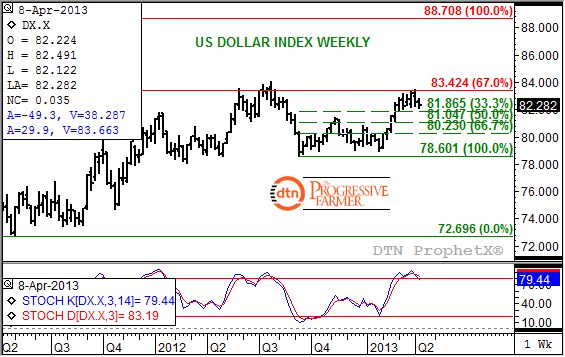
The first thing that jumps out at me is how the consolidation has occurred just below resistance at 83.424, a level that marks the 67% retracement of the previous long-term downtrend from the high of 88.808 (week of June 7, 2010, not shown) through the low of 72.696 (week of May 2, 2011). While no one-week bearish reversal has been established, the index is in position to move below the four-week low of 82.068 (this week's low) next week. Traditionally, such a move has been one way of gauging a change in momentum in a market.
Another way is the use of weekly stochastics (bottom study). Notice that this week's action has the faster moving blue line (79.4%) below the slower moving red line (83.2%). If this relationship holds through Friday's close it would establish a bearish crossover, offsetting the bullish crossover (blue line moving above the red line) seen the week of September 24, 2012. Note that the bullish signal occurred with both lines below the oversold level of 20% (17.8%, 16.4% respectively) indicating a strong change in trend.
In this case, unless things change through the close, the blue line is actually below the overbought level of 80%. This weakens the signal in comparison to both lines being above that level, resulting in a possible sideways to down trend as opposed to a strong downtrend. This being the case it is unlikely the index will fall all the way back to its previous low of 76.601 (week of September 10, 2012) that was posted in conjunction with the previously mentioned bullish crossover by weekly stochastics, instead finding support near 81.047, the 50% retracement of the most recent uptrend through the high of 83.494 (week of April 1, 2013).
If the US dollar index does indeed turn sideways to down, commodities in general could find renewed buying interest. The main sectors of energies, metals, and even grains could see an upturn, particularly given the pressure seen in all three over recent weeks. Longer-term the commodity sector is still dealing with a bearish consensus, as reflected in the continued weakness of the Continuous Commodity Index (not shown, a subject for a later blog).
To track my thoughts on the markets throughout the day, follow me on Twitter: www.twitter.com\Darin Newsom
Commodity trading is very complicated and the risk of loss is substantial. The author does not engage in any commodity trading activity for his own account or for others. The information provided is general, and is NOT a substitute for your own independent business judgment or the advice of a registered Commodity Trading Adviser.
P[L1] D[0x0] M[300x250] OOP[F] ADUNIT[] T[]
Comments
To comment, please Log In or Join our Community .