Technically Speaking
"It's Like Deja Vu All Over Again"
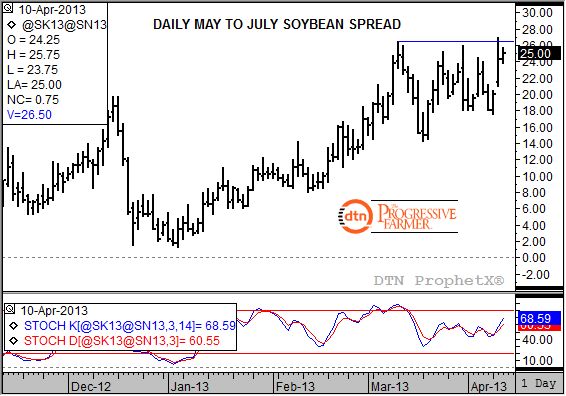
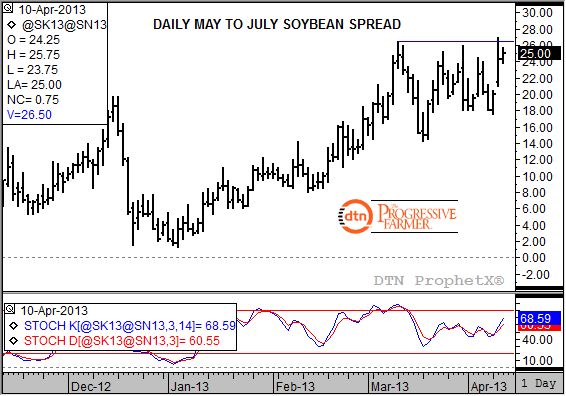
Raise your hand if you've read this analysis before: Heading into a USDA report the strong inverse in the May to July soybean futures spread is indicating a bullish supply and demand situation. I see a lot of hands up, as it should be. It was only a couple of weeks ago when we saw the same situation with the spread testing the previous high of 26 1/2 cents (blue line) on the daily chart the morning leading into the March 28 Quarterly Stocks report. And even though the report was not bearish for soybeans, the spread on that day posted a sharp outside trading range (you can easily spot it on the daily chart, going back 9 lines to the left) before closing at an inverse of 19 1/4 cents.
Wednesday morning sees the spread testing its new high of 27 cents established on Tuesday, April 9. If trading in a vacuum, without the influence of any other markets, the daily chart would indicate that the trend in the May to July spread is breaking out of its consolidation range and set to move up. And, an uptrend in a spread reflects more bullish fundamentals.
Over the last 25 years I have used the trend in spreads for a reading on what the market believes supply and demand to be. Since the reaction to the quarterly stocks numbers, questions have come up as to the reliability of futures spreads these days. For now, I will continue to argue that global fundamentals in soybeans are tighter than what government numbers are indicating.
Pre-report estimates for US ending stocks ranged from 160 mb to 107 mb, with the average coming in at 137 mb. In March, USDA projected the domestic number at 125 mb. Estimates for global ending stocks ranged from 62.0 mmt to 58.2 mmt with an average of 60.1 mmt, as compared to March's 60.2 mmt. The move in the May to July spread would hint that the real supply and demand situation is at least as tight as the low end of both ranges.
What happens if the spread falls again in response to USDA numbers? From a technical perspective it could create a potential double-top formation on the daily chart. At that point, it could probably be argued, the commercial side of the market is likely throwing in the towel.
But what if? What if the spread confirms Tuesday's breakout of the old high? After all, soybeans aren't wheat so therefore are not as prone to chart head-fakes. If the spread is actually reestablishing its uptrend, a simple measuring technique using the previous high (26 1/2 cents) through the initial low (14 1/4 cents) creates a range of 12 1/4 cents. Adding that to the breakout point (26 1/2 cents) creates a possible upside target of almost 39 cents, or a challenge of the high established on September 4, 2012.
P[L1] D[0x0] M[300x250] OOP[F] ADUNIT[] T[]
To track my thoughts on the markets throughout the day, follow me on Twitter: www.twitter.com\DarinNewsom


Comments
To comment, please Log In or Join our Community .