Minding Ag's Business
How the DTN Digital Yield Tour Compares to ProFarmer, USDA Corn Estimates in 2022
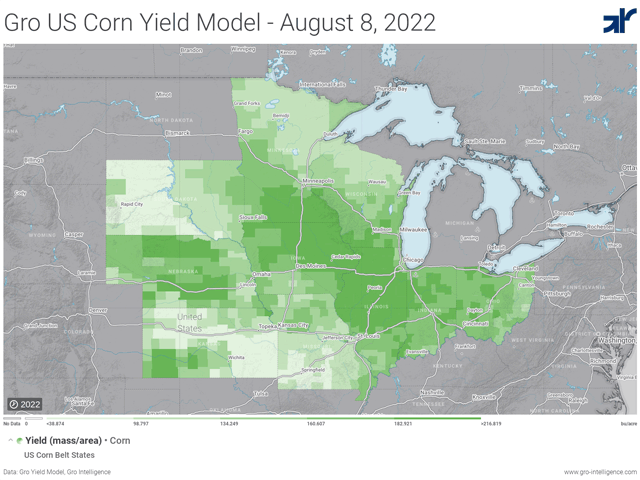
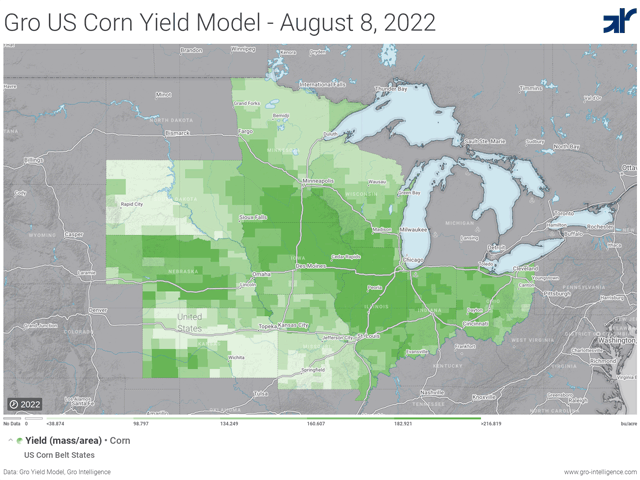
The 2022 DTN Digital Yield Tour, powered by Gro Intelligence, made a bold pronouncement in early August. The U.S. corn crop looked to be coming up short, with the national yield averaging 167.2 bushels per acre (bpa) on Aug. 8.
But the question was, how would Gro's high-tech estimates compare to USDA numbers? How about to ProFarmer Midwest Crop Tour estimates? Would they all come to the same conclusion, or was Gro an outlier with its low estimate?
All three entities attempt to ascertain the size of the national corn crop but go about it in very different ways. Those differences are important considering the timing in early-to-mid August.
Each year, Gro Intelligence opens up its corn and soybean yield models to DTN readers, sharing yield estimates at the county, state and national levels in 10 states. Gro's real-time yield estimates are generated using satellite imagery, rainfall data, temperature maps and other public and private data and use machine learning to improve over time.
P[L1] D[0x0] M[300x250] OOP[F] ADUNIT[] T[]
This year, the Digital Yield Tour released national yield estimates on Aug. 8, ahead of its state-by-state yield estimates. Gro's yield models update every day, and Digital Yield Tour estimates reflect the models on the day of publication. You can find more on the tour's results and methods here: https://spotlights.dtnpf.com/….
It found a crop that was highly variable, not only across regions, but also within states. From drought in the Corn Belt's western reaches to a cold, wet start to the season in key growing regions to sweltering summer heat, it seemed every area had an issue. Even the best crops were only average, and the bad ones, well, they were rough. But there was everything in between, too.
"The model provides a lot of granularities," Gro Intelligence Senior Analyst Jon Haines said, and this year's map reveals a lot of haves and have-nots. "It reminds me of something I've always heard: Variation is never a good thing for national yields."
USDA's National Agricultural Statistics Survey issued its first estimate for corn on Aug. 12, based on the results of its farmer survey. It put the national average yield at 175.4 bpa, just a few bushels below trendline. While it wasn't as big of a jump as Gro's estimates, USDA's estimate was about what everyone expected. Typically, the agency waits until September, when it collects field-level data on things like ear length and kernel count, before making big changes to its yield estimate.
Then, during the week of Aug. 22, the ProFarmer Midwest Crop Tour drove across seven states, walked into fields and estimated what they'll yield. The estimates were compiled each day, and the tour released the statewide average of its findings.
At the end of the tour, the ProFarmer publication also released national and state estimates. These estimates were not bound to the findings of the crop tour. They're determined by people in a room that discuss the findings and other information to come to a consensus about the possibilities.
This year, that subjective yield estimate came in about a bushel higher than the national yield estimate from the DTN tour.
DTN will check in on Gro's yield models in early September to see how they've changed. Until then, you can find a full table comparing the three types of yield estimates below.
| CORN YIELDS | ||||
| AUGUST | 2021 | |||
| GRO INTEL | PROFARMER | USDA | USDA | |
| NATIONAL | 167.2 | 168.1 | 175.4 | 177 |
| ILLINOIS | 196.9 | 190.7 | 203 | 202 |
| INDIANA | 180.9 | 177.9 | 189 | 195 |
| IOWA | 180.4 | 183.8 | 205 | 205 |
| KANSAS | 118.5 | 123 | 139 | |
| MINNESOTA | 173.1 | 190.4 | 193 | 178 |
| MISSOURI | 142.8 | 153 | 160 | |
| NEBRASKA | 158 | 158.5 | 181 | 195 |
| OHIO | 178.9 | 174.2 | 190 | 193 |
| SOUTH DAKOTA | 128.9 | 118.5 | 147 | 135 |
| WISCONSIN | 169.7 | 185 | 180 | |
Katie Dehlinger can be reached at Katie.dehlinger@dtn.com
Follow her on Twitter at @KatieD_DTN
(c) Copyright 2022 DTN, LLC. All rights reserved.


Comments
To comment, please Log In or Join our Community .