Market Matters Blog
USDA Report Shows Spring Wheat Supplies in Peril
Each month, USDA releases their World Agricultural Supply and Demand Estimates (WASDE), providing the market with the Department's best guess on a range of production and demand forecasts. It is only every quarter, however, that we see the release of the USDA's National Agriculture Statistics Survey (NASS) quarterly Stocks report. These four reports reign supreme in my opinion, as they provide actual data on the stocks of grain held both on-farm and off. The data provided are not estimates or a range of possibilities; they are the actual physical level of grain in the United States on a set date. This data can, and often does, set price expectations for the following weeks and months. On the Sept. 1 Stocks report, released on Sept. 30, USDA showed the spring wheat supply situation in the United States is even more grave than feared this summer.
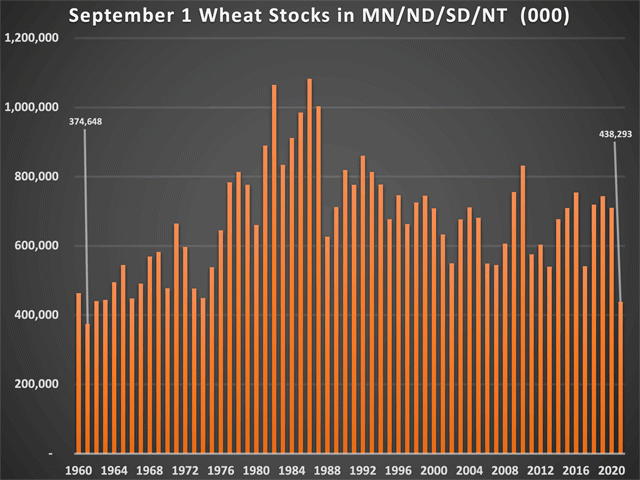
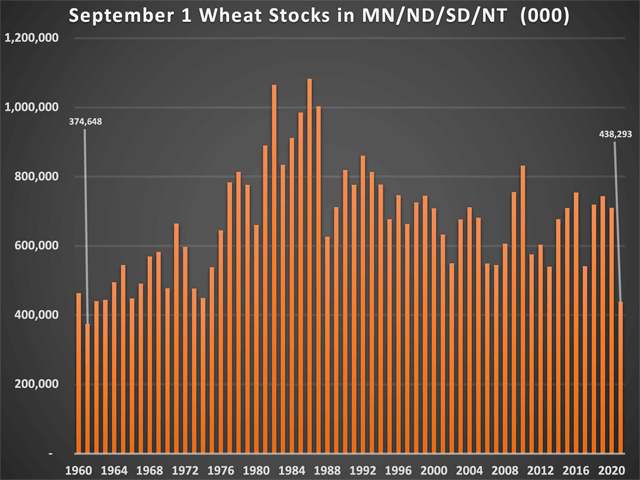
For quite some time, we have taken stocks data for wheat and viewed it for a collection of states that accurately reflects the major classes in the United States. For example, we like to group Texas, Oklahoma and Kansas together to get a view on hard red winter wheat. For soft red wheat, we group Illinois, Indiana, Ohio and Michigan. For hard red spring wheat, we look at Montana, North Dakota, South Dakota and Minnesota, which we will refer to as the spring wheat belt states. Even though South Dakota and Montana raise a fair amount of hard red winter wheat, we think the group gives an accurate picture of the spring wheat supply situation. On Sept. 1, wheat stocks in all positions in the spring wheat belt states totaled 438.2 million bushels (mb) versus 710.4 mb a year ago. The 438.2 mb total was the smallest for that date since 1961. The year-over-year drop from Sept. 1, 2020, to Sept. 1, 2021, was 38.3%, which is the largest drop on record going back to 1949.
P[L1] D[0x0] M[300x250] OOP[F] ADUNIT[] T[]
Wheat stocks can be broken out into on-farm stocks or off-farm stocks, which would be those already held in commercial hands. On-farm stocks, as of Sept. 1, totaled 231.5 mb, which was the smallest since 1963; off-farm stocks totaled 206.7 mb, the smallest since 2014. As a percentage of total stocks, on-farm stocks represented 53% of the total, which is the smallest ratio since 1964 and compares with a five-year average of 66%, and that number has several implications for the rest of the marketing year. For starters, it says of the amount of wheat in those states, a larger-than-normal percentage moved during harvest, will most likely take advantage of the high prices available off the combine.
Farmers and commercials have different motivations when it comes to marketing. Traditionally, producers are motivated by futures prices and tend to sell bushels when the futures rise or fall to meet their selling objectives. Commercials, on the other hand, are almost always hedged and are therefore motivated more by basis and spreads. In other words, with the commercials holding a higher-than-normal percentage of the spring wheat crop, it could mean the obligation to move wheat will be on the cash market, not the futures market.
Whenever one discusses a tight supply situation in spring wheat, it is inevitable that a comparison to 2008 follows, because that's when spring wheat prices rose to $25 per bushel. While there are certainly similarities to 2008, the current spring wheat supply situation in North America is actually more dire this year.
To truly have a spring wheat problem, production issues must exist on both sides of the border. Canada is estimated to have produced a spring wheat crop of 771.54 mb, the smallest crop since 2007-08 when the country raised a crop of 738.1 mb. Carryout supplies in Canada are seen at 164.8 mb this year versus 160.4 mb in 2007-08.
In the U.S., hard red spring wheat production totaled 297 mb versus 450 mb in 2007-08. Carryout for 2021-22 is projected at 113 mb versus 68 mb in 2007-08. In 2007-08, it wasn't so much a supply problem in the United States as a demand one, as supplies were in line with the year before, but total demand rose to a seven-year high. Total wheat stocks in the spring wheat belt states are about 100 mb smaller than on Sept. 1, 2007, highlighting how much tighter supplies could get by the end of the marketing year. Viewed collectively, spring wheat production in North America is about 120 mb smaller than in 2007-08, while ending stocks are projected roughly 50 mb larger.
The spring wheat market is facing almost unprecedented tightness following the worst drought in the Northern Plains and Canadian Prairies in several decades. A larger-than-normal portion of the available crop rests in commercial hands, which should promote much stronger cash markets and calendar spreads this winter, especially if adverse winter weather threatens logistics. While the once-in-a-lifetime event of $20 wheat prices is not likely to be repeated for myriad reasons, a strong price environment is required to prevent supplies from being exhausted by the end of the marketing year.
Tregg Cronin can be reached at tmcronin31@gmail.com
Follow him on Twitter @5thWave_tcronin
(c) Copyright 2021 DTN, LLC. All rights reserved.


Comments
To comment, please Log In or Join our Community .