

Canada Markets
Early Estimates for North American HRS Acres

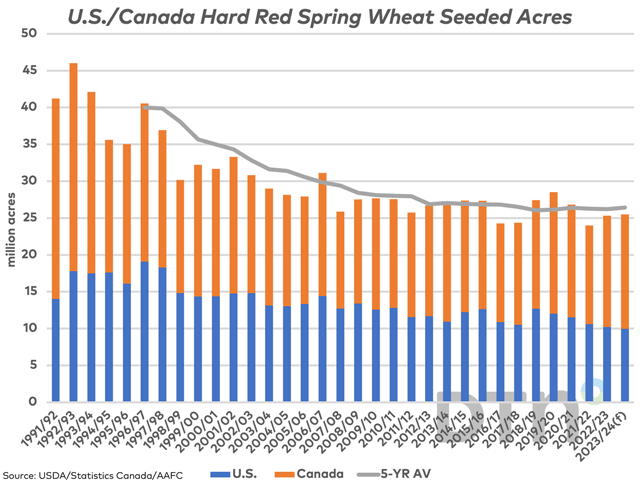
The USDA's most recent Prospective Plantings report estimates spring wheat acres at 10.570 million acres, down 2.4% from 2022, a fifth consecutive annual drop and is down 12.6% from the five-year average of 12.087 million. According to the USDA's historical data, this is the smallest spring wheat planted area since 1972. Of this area, an estimated 9.95 million acres will be dedicated to hard red spring wheat, which is the smallest area seeded in USDA data seen in USDA data going back to 1986-87, down 2.5% from 2022 and 12.8% below average.
In January of this year, Agriculture and Agri-Food Canada's first unofficial forecast for 2023-24 included a 4% increase in overall wheat acres, with spring wheat acres estimated at 18.285 million acres. On average during the past five years, HRS has accounted for 85.1% of all spring wheat acres, which would lead to 15.566 million acres of hard red spring wheat seeded.
This area would be 444,200 acres higher than seeded in 2022 and is 3.7% higher than the five-year average of 15 million acres. Based on the earliest of estimates, the increase in prairie spring wheat acres will off-set the decline in expected U.S. acres. Note that Statistics Canada will release its first official estimates on April 26.
P[L1] D[0x0] M[300x250] OOP[F] ADUNIT[] T[]
The attached chart shows the long-term trend in combined U.S./Canada HRS acres, currently forecast at 25.516 million acres, or the highest in three years. This is roughly 900,000 acres below the five-year average.
The continuous December HRS/HRW spread can be used as a proxy for the demand for spring wheat relative to the lower protein hard red winter wheat. On March 31, this spread strengthened 10.5 cents to 39 cents (HRS above HRW), following the USDA's data release. On April 4, this spread closed at 34.75 cents, down for a second day.
On average over the past five years, this spread traded at 55 1/4 cents (HRS over HRW) on April 4. Since January 1, 2022, this spread ranged from a high of 93 3/4 cents to a low of minus 63 cents, with the mean spread at 32.29 cents. The current spread is only slightly higher than this mean, signaling no sense of urgency.
Over the past several months, the spread chart shows consolidating trade within a triangle chart pattern, while only time will clarify which direction this line will break out.
Cliff Jamieson can be reached at cliff.jamieson@dtn.com
Follow him on Twitter @Cliff Jamieson
(c) Copyright 2023 DTN, LLC. All rights reserved.
Comments
To comment, please Log In or Join our Community .