Canada Markets
USDA Points to Bullish Spring Wheat Fundamentals in the US
The most bullish estimates to come out of today's July USDA World Agricultural Supply and Demand Estimates (WASDE) report is the spring wheat estimates. Production estimated for the other spring class in the U.S. was pegged at 345 million bushels, which is down 41% from 2020 while hard red spring wheat production is estimated at 305 mb, down 42% from 2020.
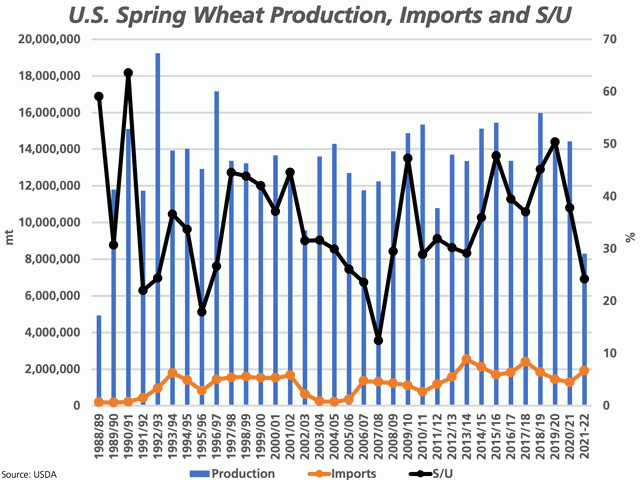
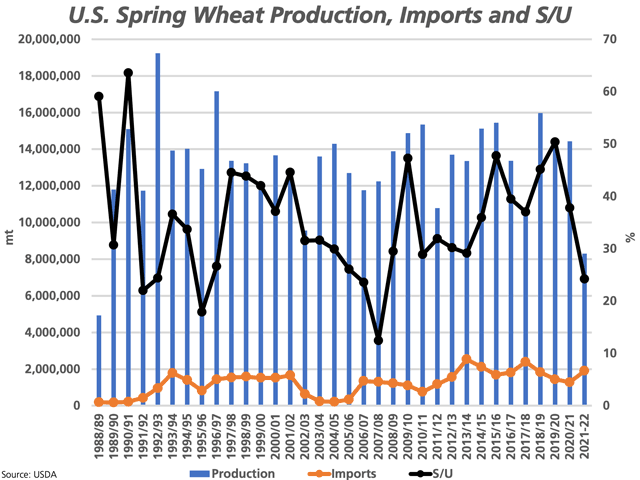
The blue bars on the attached chart represent estimated U.S. production, shown in metric tons for a Canadian perspective. The 305 mb represents 8.3 million metric tons, which is also down 39.3% from the five-year average and a similar amount below its 10-year average. This would be the lowest hard red spring wheat production since 1988-89, while only the third time over this period that production has fallen below 10 mmt.
The brown line represents the USDA's forecast U.S. hard red spring wheat imports. This volume has been estimated at 1.9 mmt for 2021-22, increasing for the first time in four years to the highest level seen during the four years. This is up 48.9% from 2020-21, while over the period shown on the chart, was only exceeded three times with 2013-14 imports totaling 2.534 mmt, the highest volume seen over this period.
P[L1] D[0x0] M[300x250] OOP[F] ADUNIT[] T[]
The black line with markers represents the stocks/use ratio for U.S. spring wheat. U.S. data shows this as reaching as high as 50.4% as recent as two years ago or in 2019-20, the highest seen since 1990-91, while July data shows this calculation at 24.2%, the lowest level seen since 2007-08. This ratio has been shown lower on only four of the years during the 34 years shown on the chart.
A valid question was asked during DTN's July WASDE Webinar today and that was how high can the Minneapolis future go when much of the Canadian Prairies is also facing similar challenges? While prairie producers will have clear insight into the devastation caused by dry conditions and extended record-breaking heat, Statistics Canada will not release official production estimates based on July surveys until Aug. 30. On Sept. 14, the agency will release model-based estimates based on August data.
Resistance from weekly highs on the continuous active chart are seen at the July 2017 high of $8.68 1/2/bushel (bu), the July 2012 high of $10.35/bu and the June 2011 high of $11.20/bu. A breach of the nearby $8.68 1/2/bu could clear the way for a continued move to the 33% retracement of the move from the February 2008 high to the September 2009 low, calculated at $9.73 1/4/bu.
**
DTN 360 Poll
This week's poll question asks which crop you think has the greatest upside price potential over the upcoming crop year. Please feel free to weigh in with your thoughts, with this poll found on the lower-right side of your DTN Home Page.
Cliff Jamieson can be reached at cliff.jamieson@dtn.com
Follow him on Twitter @Cliff Jamieson
(c) Copyright 2021 DTN, LLC. All rights reserved.


Comments
To comment, please Log In or Join our Community .