

Fundamentally Speaking
Soybean Farmer Marketing
Similar to what has been seen with U.S. corn farmers, soybean producers have also been refraining from selling their recently harvested 2018 bushels on the market.
Farmers are deterred by low prices and having a little more storage space than they had expected given the drawn out harvest due to a wet fall in the Midwest that eliminated to a large extent any forced sales.
Soybean producers are also supposed to receive $1.65 per bushel from the Market Facilitation Program (MFP) which provides partial compensation to farmers and share-rent landowners for losses occurring because of trade disputes.
Finally it is hoped that the recent trade negotiations between the U.S. and China would result in large Chinese purchases of U.S. soybeans that would give prices a good boost.
P[L1] D[0x0] M[300x250] OOP[F] ADUNIT[] T[]
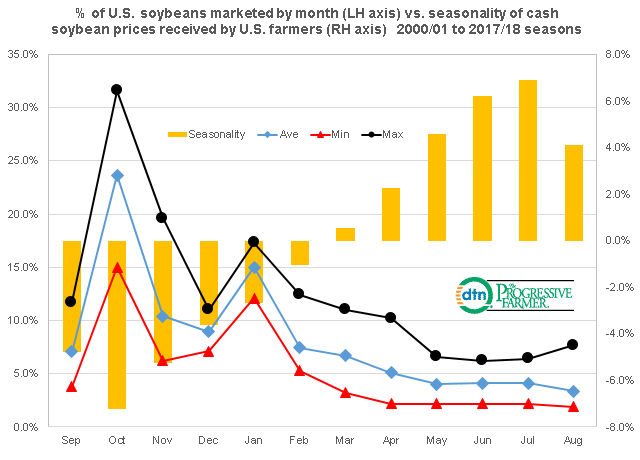
This graphic shows the percent of U.S. soybeans marketed by month during the marketing year that goes from Sep 1 to August 31 on the left hand axis vs. the seasonality of cash soybean prices received by U.S. farmers on the right hand axis using data from the 2000/01 to 2017/18 seasons.
Even though farmers know that the lowest prices are usually at harvest, often when they have filled up their on farm storage, they will sell some cash grain when supplies are heaviest to avoid making ground piles.
October is the highest month for marketings at an average of 23.6% and for the past 18 years about 50.1% has been marketed by the end of the calendar year.
We also note that in recent years the soybean market has been inverted with the nearby prices higher valued than the more deferred slots due to relatively tight supplies and this has also encouraged producers to sell their crop very early in the marketing year.
The second most popular month for farmers to sell is January where the 2000-2018 average is 15.0% of their supplies marketed that month.
Reasons for this include some sort of post-harvest price recovery and producer desires to limit sales until after the first of the year for tax purposes.
We were curious to see how farmer marketings matched up vs. the usual season price patterns of soybeans where values are lowest during the harvest period and gradually improve from that point on with the higher prices seen in June and July that are respectively 6.2% and 6.9% above the yearly average.
Note that the 50.2% marketed from September to December does coincide with the lowest prices of the year as cash flow considerations and the need to generate funds for spring plantings often does not allow a producer to sell later in the marketing season when prices are higher though utilizing forward contracts that do capture some of the carry in the market if it exists does enhance returns.
(KA)

Comments
To comment, please Log In or Join our Community .