

Fundamentally Speaking
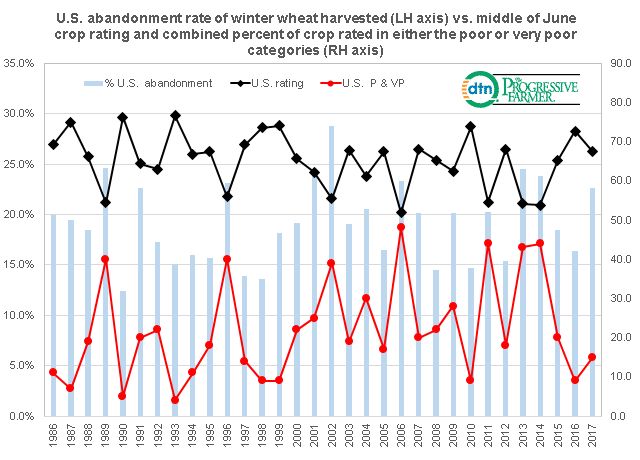
Winter Wheat Abandonment Rates vs. Mid-June Crop Ratings

With all the focus on the Argentine drought and its adverse impact on that country's corn and soybean crop, extreme dryness here in the U.S. is wreaking severe damage on the nation's winter wheat crop, especially the hard red winter variety grown mostly in the Central and Southern Plains.
July Kansas City wheat futures have made new highs for the move from a low of $4.40 per bushel as of December 11, 2017 to a recent high of $5.23.
The USDA released a number of crop condition reports as of the end of February for key winter wheat producing states and showed the largest producing state of Kansas with a mere 13% of their crop rated in either the good or excellent categories yet 49% in the lowest two categories of poor or very poor.
The ratings in Oklahoma are even worse with none in the excellent category, only 4% rated good and a whopping 78% of the crop either in poor or very poor shape.
The USDA last released a national rating on November 27th and will not release another one until early April but when it does, it is expected to show a large part of the U.S. winter wheat crop either in poor or very poor condition and this implies not only a below trend yield but a high rate of abandonment or a very low harvested to planted acreage ratio.
P[L1] D[0x0] M[300x250] OOP[F] ADUNIT[] T[]
To examine the impact of a poor wheat crop on the decision to either harvest the crop or disk it under we looked at the harvested to planted ratio for the U.S. as a whole and define abandonment as 1 --(harvested/planted ratio).
For instance last year planted winter wheat acreage in the U.S. was 32.7 million acres with 25.3 mln harvested for a harvested/planted ratio of 77.3% or a 22.7% abandonment rate.
This is above the 1986-2017 average of 19.1% but note there were even worse years such as a 28.8% abandonment rate in 2002 and a 24.7% abandonment rate in 1989.
These must have been years when U.S. winter wheat conditions were terrible so to test this we looked at the U.S. winter wheat crop ratings as of week 22 which is around the middle of June two ways.
First we summed the percent of the crop either in the poor or very poor category and then used our usual ratings system where we weight the crop based on the percent in each category and assign that category a factor of 0.2 for very poor, 0.4 for poor, 0.6 for fair, 0.8 for good, and 1.0 for excellent and then sum the results.
In 1989 the middle of June crop rating for the U.S. winter wheat crop was 54.4 with 40% rated either poor or very poor.
In 2002 the middle of June crop rating for the U.S. winter wheat crop was 55.4 with 39% rated either poor or very poor.
The only years worse appear to be 2006 when the crop rating was 51.8 with 48% either poor or very poor and that year the abandonment rate was 23.3%, 2013 when the crop rating was 54.2 with 43% either poor or very poor and that year the abandonment rate was 24.5% and 2014 when the crop rating was 53.8 with 44% either poor or very poor and that year the abandonment rate was 24.5%.
Note the correlation between abandonment rates and the crop rating is 76.2% and abandonment rate and the combined percent rated either poor or very poor at 74.3%
(KA)
© Copyright 2018 DTN/The Progressive Farmer. All rights reserved.
Comments
To comment, please Log In or Join our Community .