

Technically Speaking
Spot Soybean Meal Shows Potential Bullish Chart Signals

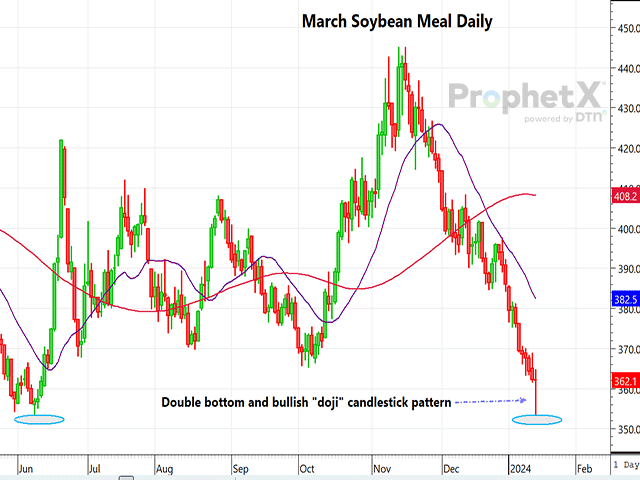
Recent beneficial rains in the driest areas of Brazil, ongoing beneficial weather in Argentine soy growing regions, along with cheaper South American soymeal values in the spring, have all catapulted March soymeal to deep losses. Just since Nov. 15, we have seen March soymeal plummet as much as $92 per ton as once ultra-long managed money funds chose to liquidate their long position. In that time frame, funds went from a net long of 140,000 contracts to just 16,000 contracts as of Jan. 9, and they are likely close to even as the post-holiday week begins. That's a sale of 124,000 contracts of soymeal in just 60 days.
The result of the soymeal plunge saw March meal test the June low of $353.50 before finishing Jan. 12 roughly $9 per ton higher than that. The resulting chart pattern on last Friday is called a "doji," where the market opened and closed at the same price level. The theory on the Japanese candlestick pattern is that sellers may have run out of bullets. In order to lead to a confirmed buy signal, however, the market must finish higher the next day. So, we will see if March meal can manage a higher finish on Jan. 16. Adding to the potential for this to be a believable reversal signal is the potential for the double bottom. Granted, U.S. soymeal export sales have slowed with the return of Argentina, but this is a market that has been beat up and technically oversold. Now that funds are virtually out of their long position, we shall see if this market is poised for a recovery. Based on the two technical signals alone, it would appear to be.
P[L1] D[0x0] M[300x250] OOP[F] ADUNIT[] T[]
March soybean futures have also been in freefall mode, plunging $2.08 per bushel from high to low since Nov. 15. Granted, the recent weather change in central and northern Brazil was instrumental in the soy futures drop; this is also a market where funds have liquidated their long position and actually reversed course to a new short position. From a long position of near 100,000 contracts in mid-November, managed money funds as of Jan. 9 reveal a new short position of more than 33,000 contracts. Friday's January World Agricultural Supply and Demand Estimates (WASDE) report sure did not help the bulls, with a higher yield, production and ending stocks number adding to the selling.
The jury still seems to be out on the ultimate size of the Brazilian bean crop, with some private analysts still as much as 5 million metric tons (mmt) to 6 mmt below USDA's recently revised estimate. Although the trend is definitely your friend, and that trend is down, this is a market that could see at least a short-term recovery to the upside. Longer term, it certainly depends on the ultimate size of the Brazil crop, with Argentina already on pace to more than double last year's drought-decimated soy crop, providing plenty of competition for U.S. soy export sales, which are already down 17% from a year ago.
Comments above are for educational purposes only and are not meant as specific trade recommendations. The buying and selling of commodities, futures or options involve substantial risk and are not suitable for everyone.
Dana Mantini can be reached at Dana.Mantini@DTN.com
(c) Copyright 2024 DTN, LLC. All rights reserved.
Comments
To comment, please Log In or Join our Community .