
Technically Speaking
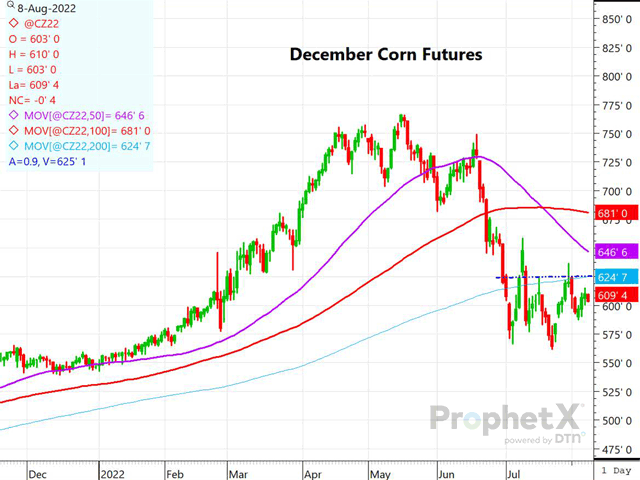
December Corn Moving Sideways Now With Seasonal Tendency, USDA Report Ahead

With the hot, dry weather we have seen in the Western and Southern Plains, corn yield is surely being compromised in some areas -- most notably, Kansas, Nebraska, South Dakota and Missouri. Kansas and Nebraska combined have 15.1 million acres of corn planted in 2022. While USDA is still at 177 bushels per acre (bpa), the August report will be released Friday, Aug. 12, and we will get to see new national and state yield estimates. Private analysts see the potential for national corn yield, based on current conditions, to fall to the 173 bpa to 174 bpa range. Adding to the excitement of Friday's report is the fact that in the past four years, December corn futures have bottomed between Aug. 12 (2020) and Sept. 19. In August of 2020, the rally which began on Aug. 12 moved $1.10 higher. I suppose one could call it a coincidence, but it is more like a reliable seasonal pattern in the past four years. For 2022, the jury is still out, and we'll see what happens this week. Following weeks of above-normal temperatures impacting the Western and Southern Plains corn growing areas, I would be more inclined to think that yield is on a downhill slide, with ending stocks moving lower as well. Only time will tell.
SEPTEMBER SOYBEAN MEAL FUTURES:Is that a bull-flag chart pattern on September soybean meal? It sure looks like one. In the past several months, soybean meal futures have been the shining star of the soy complex. In the past 10 to 11 days, that seems even more so. The contract appears to be coiling or consolidating within a large bull-flag chart pattern, which would hint at even more upside potential. A breakout above the $450 to $452 area or below the $430 area would likely determine the future path on meal. With soymeal demand in the U.S. very strong, basis at very high levels in the central U.S., and export sales overperforming (186,000 mt last week), plus the potential for soy yields to move lower from here following months of hot-and-dry weather in the Plains and south, it seems like the path of least resistance could be higher. Friday's USDA August report could lay the foundation for a move, one way or the other. Stay tuned.
P[L1] D[0x0] M[300x250] OOP[F] ADUNIT[] T[]
As in corn, Kansas City September wheat futures have been trading in a choppy, sideways fashion, within a tight range. That can either be a bottoming-type pattern or a continuation pattern of the bearish trend that we have seen. So far, after five to six solid tests of the $8.20 area, KC September has been unable to breach that support. World wheat fundamentals remain bullish, so one would think the path of least resistance could be to the upside. While wheat shipments have not been part of the Ukraine safe shipping program just yet, that could be coming, which of course would be a bit negative, as could the spring wheat harvest. Should there be any snag in that brokered deal to ship Ukraine ag products or should corn and beans have a reason to rally following Friday's USDA report, it becomes very possible that wheat again resolves to the upside.
**
Comments above are for educational purposes only and are not meant as specific trade recommendations. The buying and selling of grain or grain futures or options involve substantial risk and are not suitable for everyone.
Dana Mantini can be reached at Dana.Mantini@DTN.com
Follow him on Twitter @mantini_r
(c) Copyright 2022 DTN, LLC. All rights reserved.
Comments
To comment, please Log In or Join our Community .