

Technically Speaking
Buying Room for Old King Cotton

As I discussed in a recent Newsom on the Market Column, old King Cotton could take away acres from new (relatively, but showing some age) King Corn in 2018. In the piece N.S.E.W (from March 16), I talked about how some farmers in southeast Texas were planning on going back to cotton instead of corn. A look at the attached weekly chart for the new-crop December cotton contract and it's clear to see why.
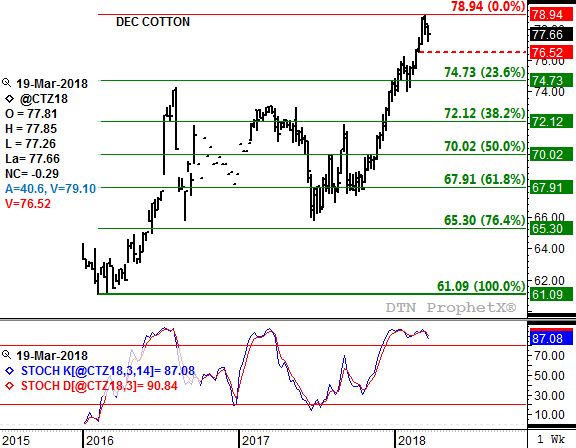
The secondary (intermediate-term) uptrend in Dec 2018 cotton has taken it from a low of 61.09 (cents per pound) the week of February 8, 2016 to a high of 78.94 the week of March 12, 2018. Note the weekly stochastics (intermediate-term momentum indicator) study at the bottom of the chart you see the contract established an initial bullish crossover (faster moving blue line crossing below the slower moving red line) above the overbought level of 80% the week of January 22, 2018. This was an initial warning signal that the market could soon form a top.
P[L1] D[0x0] M[300x250] OOP[F] ADUNIT[] T[]
However, the contract never confirmed a top was in place. One of the key signs I look for is a new 4-week low, meaning for a top the contract trades below the previous 4-week low, confirming a bearish change in momentum. After the late January crossover by stochastics, the futures contract consolidated, but never confirmed a move to a new secondary downtrend.
Fast forward to this past week. Dec cotton continued to fall back from the previous week's peak of 78.94, a week also notable for the establishment of a secondary (confirming) bearish crossover by stochastics. Dec cotton fell to a low of 77.22 before rallying a bit into the weekly close of 77.66. Heading into this week 4-week low support is shown at 76.52 (dashed red line). Given that weekly stochastics now have two bearish crossovers, both actually above 90%, the logical assumption would be that cotton is set to firmly establish an intermediate-term downtrend.
The December-to-March futures spread (not shown) is trending sideways at a neutral 0.19 carry. Last Friday's CFTC Commitment of Traders report showed noncommercial interests reducing their net-long futures position (through Tuesday, March 20) by about 4,700 contracts, though still holding a large net-long of 100,626 contracts. What could be the trigger to set off an even larger liquidation of this position?
The first thing that comes to mind is Thursday's USDA Prospective Plantings report. Early estimates from the National Cotton Council of America put 2018 plantings at 13.1 million acres (ma), up from 2017's 12.6 ma. In fact, U.S cotton acres have been on the rise since 2015's 8.6 ma, and if the 13.1 ma is realized later this spring, it would be the largest planted area of U.S. cotton since 14.7 ma back in 2011 and the third largest area since the beginning of King Corn's ethanol fueled demand market from 2006. That year of transition saw 15.3 ma planted to cotton.
If the Dec 18 contract moves to a new 4-week low this week, initial support is at 74.73. However, given how high weekly stochastics remain a deeper retracement would be expected, setting targets at 72.12 and possibly 70.02. After that, much will depend on how the December-to-March spread is trending, reflecting a more bullish (uptrend) or bearish (downtrend) commercial view of supply and demand.
To track my thoughts on the markets throughout the day, follow me on Twitter:www.twitter.com\Darin Newsom
Comments
To comment, please Log In or Join our Community .