

Technically Speaking
Weekly Analysis: Corn and Soybean Markets

Corn (Cash): The DTN National Corn Index (NCI, national average cash price) closed at $3.30 3/4, up 5 1/2 cents for the week. The NCI remains in a secondary (intermediate-term) uptrend on its weekly close-only chart. However weekly stochastics are above 80%, indicating a sharply overbought situation and in position for a bearish crossover, as the NCI tests resistance near $3.30. This price marks the 61.8% retracement level of the previous downtrend from the high weekly close of $3.48 through the low weekly close of $3.00.
Corn (Old-crop Futures): The July 2018 contract (analyzed for DTN Strategy purposes) closed 4 cents higher at $3.77 1/4. The contract remains in a secondary (intermediate-term) uptrend, posting a new 4-week high of $3.78 1/4 last week. Initial resistance is at $3.79, a price that marks the 23.6% retracement level of the previous downtrend from $4.34 1/4 through the recent low of $3.62. The 38.2% retracement level is up at $3.89 1/2. National average basis (NCI minus futures) versus the July contract (for DTN Strategy purposes) strengthened by 1 3/4 cents last week to 46 1/2 cents under.
P[L1] D[0x0] M[300x250] OOP[F] ADUNIT[] T[]
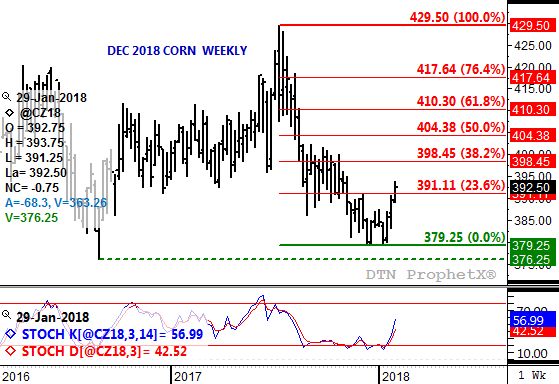
Corn (New-crop Futures): The December 2018 contract closed 3 cents higher at $3.92 1/2. Dec corn's secondary (intermediate-term) trend remains up as the contract posted a new 4-week high of $3.94. Next resistance is near $3.98 1/2, a price that marks the 38.2% retracement level of the previous downtrend from $4.29 1/2 through the low of $3.79 1/4. The 50% retracement level is up near $4.04 1/2, with new-crop corn's 5-year seasonal index target (weekly close only) at $4.15 in early June. Weekly stochastics are bullish above the oversold level of 20%.
Soybeans (Cash): The DTN National Soybean Index (NSI, national average cash price) closed at $9.09 3/4, down 7 1/4 cents for the week. The NSI posted a bearish outside range last week, signaling a possible turn to bearish momentum. Cash soybeans' minor (short-term) trend is down on daily charts as well, with support pegged at $8.99 3/4.
Soybeans (Old-crop Futures): The May contract (analyzed for DTN Strategy purposes) closed at $9.90 1/4, down 6 3/4 cents for the week. The contract posted a bearish outside range on its weekly chart as the minor (short-term) downtrend gained momentum on its daily chart. Next minor support is at $9.85 3/4, then $9.78 3/4. These price mark the 50% and 61.8% retracement levels of the previous short-term uptrend from $9.55 3/4 through the recent high of $10.16. Daily stochastics remain bearish, having moved back below the overbought level of 80% but still well above the oversold mark of 20%. National average basis (NSI minus futures) weakened by 1/2 cent for the week to 80 1/2 cents under the May last Friday.
Soybeans (New-crop Futures): The November 2018 contract closed at $9.99, down 3 3/4 cents for the week. The contract extended the minor (short-term) downtrend on its daily chart last week, testing support between $9.99 and $9.93 1/2. These prices mark the 38.2% and 50% retracement levels of the previous minor uptrend from $9.67 1/2 through the high of $10.17. Daily stochastics remain bearish, moving below the overbought level of 80% but still well above the oversold mark of 20%. This would indicate there is still room for the contract to move to the downside.
To track my thoughts on the markets throughout the day, follow me on Twitter: www.twitter.com\DarinNewsom
Comments
To comment, please Log In or Join our Community .