

Technically Speaking
Nov Beans Nearing Breakout
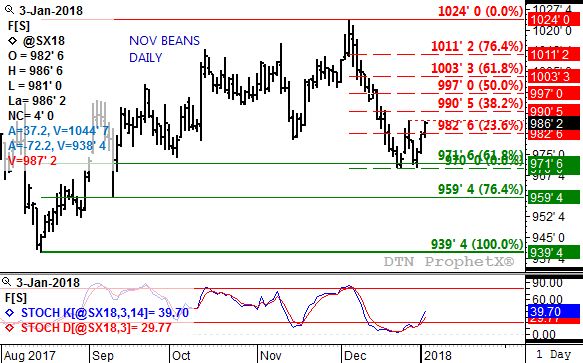
The move to a minor (short-term) downtrend by new-crop November soybeans in early December 2017 was sharp and swift. On Tuesday, December 5 the contract hit a high of $10.24. The next day Nov beans posted a low of $10.06 3/4, closed at $10.14 1/2, and its daily stochastics established a bearish crossover above the overbought level of 80%. A new minor downtrend had begun and quickly accelerated. Before the month was out the contract hit a low of $9.70 (green dashed line), testing retracement support at $9.71 3/4 (solid green line), three times (December 21, December 22, and December 29). However, after the latest low November soybeans have rallied into position for a potential bullish breakout.
Note that the interim high between the series of lows at $9.70 was $9.87 1/4 (red dotted line). That gives us a measured range of 17 1/4 cents. Also note that Nov beans posted an overnight high (January 2 into January 3) of $9.86 3/4, within a 1/2 cent of the interim peak. If November soybeans get above the previous high, then the upside target becomes $10.04 1/2 ($9.87 1/4 + $0.17 1/4). Notice that this would be a solid test of resistance at $10.03 1/2, a price that marks the 61.8% retracement level of the $10.24 to $9.70 December downtrend.
However, what I originally thought was a double-bottom at $9.70, as you read above, is actually a triple-bottom. This is at least moderately concerning given the old technical analysis adage of "triples are taken out". Keep a close eye on Nov beans as it tests its interim peak for signs of a failure.
Short-term momentum (daily stochastics, bottom study) growing more bullish would suggest an upside breakout is growing more likely. Amid the three lows and interim high, daily stochastics established a bullish crossover below the oversold level of 20%, indicating momentum had change. Since then both the faster moving blue line and slower moving red line have moved back above 20%, reflecting the growing short-term bullish momentum. Normally in this situation we tend to see daily stochastics move back to the overbought 80% level. If so, the futures contract should be pulling stochastics higher with a rally.
To track my thoughts on the markets throughout the day, follow me on Twitter:www.twitter.com\Darin Newsom
P[L1] D[0x0] M[300x250] OOP[F] ADUNIT[] T[]

Comments
To comment, please Log In or Join our Community .