

Technically Speaking
Monthly Analysis: Energy Markets
Brent Crude Oil: The spot-month contract closed at $50.31, down $1.42 on the monthly chart. The major (long-term) trend remains down following the bearish crossover by monthly stochastics above the overbought level of 80% at the end of March. Initial support is at $47.96, a price that marks the 33% retracement level of the previous uptrend from $27.10 (January 2016) through the high of $58.37 (January 2017). The 50% retracement level is down at $42.73.
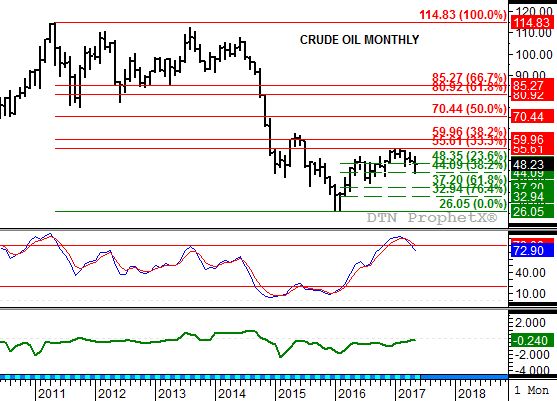
Crude Oil: The spot-month contract closed at $48.22, down $1.11 on the monthly chart. The major (long-term) trend remains down following the bearish crossover by monthly stochastics above the overbought level of 80% at the end of March. Next support is at $44.09, a price that marks the 38.2% retracement level of the previous uptrend from $26.05 (February 2016) through the high of $55.24 (January 2017). The 50% retracement level is down at $40.65.
P[L1] D[0x0] M[300x250] OOP[F] ADUNIT[] T[]
Distillates: The spot-month contract closed at $1.5153, down 1.13cts on the monthly chart. The major (long-term) trend remains down following the bearish crossover by monthly stochastics above the overbought level of 80% at the end of March. Initial support is at $1.4148, a price that marks the 38.2% retracement level of the previous uptrend from $$0.8487 (January 2016) through the high of $1.7647 (January 2017). The 50% retracement level is down at $1.3067.
Gasoline: The Chicago cash RBOB market closed at $1.6191, up 6.59cts on the monthly chart. RBOB futures continue to show conflicting, and confusing chart patterns so this analysis will once again turn to the cash market. Chicago is trending sideways, with support at the 4-month low of $1.3484 and resistance the 4-month high of $1.8153.
Ethanol: The spot-month contract closed at $1.524, down 3.4cts on the monthly chart. The major (long-term) trend remains sideways. Resistance is at $1.712, a price that marks the 23.6% retracement level of the previous downtrend from $3.07 (July 2011) through the double-bottom low of $1.292 (January 2015 and January 2016). Support is at the double-bottom low.
Natural Gas: The spot-month contract closed at $3.081, down 19.6cts on the monthly chart. Natural gas remains in a 3-wave downtrend with the February 2017 low of $2.522 the bottom of Wave A (first wave). The May high of $3.431 was not only a test of resistance at $3.432, the 61.8% retracement of Wave A, but also the peak of Wave B. Wave C would now be expected to move below the Wave A low.
Propane (Conway cash price): Conway propane closed at $0.5975, up 1.57cts on its monthly chart. The major (long-term) trend remains down following the bearish reversal posted during February. Cash propane is holding near support at $0.5813, a price that marks the 50% retracement level of the previous uptrend from $0.2525 through the February high of $0.9100. The 67% retracement level is down at $0.4714.
To track my thoughts on the markets throughout the day, follow me on Twitter: www.twitter.com\DarinNewsom

Comments
To comment, please Log In or Join our Community .