
Technically Speaking
Warming up the Winter with Oats
In my On the Market column posted on DTN subscription sites this week ("Happy New Year") I talked about how the technical patterns for corn, soybeans, and wheat haven't changed following the release of USDA's January reports. Another grain worthy of mention is oats.
Thursday's data dump left 2016-2017 oat ending stocks unchanged at 47 million bushels, down from the previous two years of 57 mb and 54 mb. Ending stocks-to-use remained at 28.5% vs. 2015-2016's 33.1% and 2014-2015's 36%. But in the grand scheme of things, ending stocks of oats aren't necessarily projected to be tight.
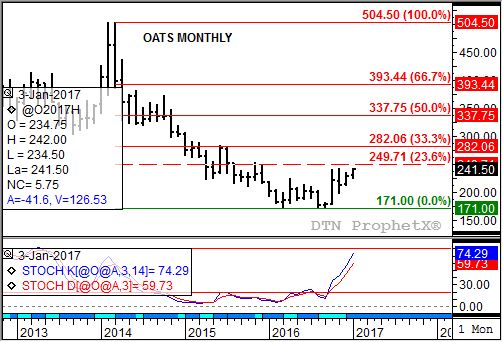
However, as its long-term monthly chart shows, oats' major trend remains up. After posting a low of $1.71 last September, nearby futures rocketed to a high of $2.43 in November, with the March 2017 contract sitting at $2.42 on Friday, January 13. A quick study of the monthly chart shows this to be just below initial technical resistance at $2.49 3/4, a price that marks the 23.6% retracement level of the previous downtrend from $5.04 1/2 (March 2014).
Given monthly stochastics (bottom study) remain bullish and below the overbought level of 80%, nearby oats could extend this uptrend to the 33% retracement level of $2.82. Notice that this level held a consolidation phase on the previous downtrend between February 2015 and July of that same year. It's interesting how often situations like that occur, providing targets of what the eventual high (or lows) might be.
But more on that another time.
To track my thoughts on the markets throughout the day, follow me on Twitter: www.twitter.com\DarinNewsom
P[L1] D[0x0] M[300x250] OOP[F] ADUNIT[] T[]

Comments
To comment, please Log In or Join our Community .