
Technically Speaking
Cotton: The Softest Uptrend in Commodities

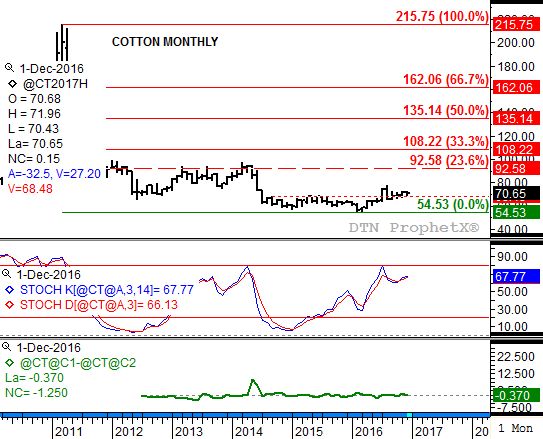
If one were to take a look at cotton's long-term monthly chart, the conclusion would like be one of indifference. The market has seemingly been moving sideways since breaking below the 68.50 level (dotted red line) back in July 2014. And outside of dipping its toes down to 54.53 this past February, the market has spent most of its time above the January 2015 low near 57.00.
An 11 1/2 cent range for roughly 2 1/2 have years: Not overly exciting in the usually fast pace world of commodities. But our eyes can be deceived easily by scale. Such is the case in cotton.
P[L1] D[0x0] M[300x250] OOP[F] ADUNIT[] T[]
The previous major (long-term) downtrend was so sharp, much of what has come after has paled in comparison. The market hit a high of 215.75 ($2.1575 per pound) back in March 2011, a price that seemed outlandish at the time and even more so today. The long fall back to this past February's low totaled a 75% loss in value, or roughly equivalent to the 2008 crude oil market when futures fell from $147 per barrel that July to $32 by December.
Back to cotton: Since its February low the market has slowly been climbing out of its hole. This past July/August saw a spike to almost 78.00 before falling back to 65.00. But no further collapse was coming, and the market resumed its climb.
How high might it go? Monthly stochastics are drawing nearer to the overbought level of 80% with each turn of the calendar page. Ultimately this could limit the market's upside potential. Technically this past summer's saw the market break out of its 14.00 range (approximately 68.50 to 54.50), setting the upside target at 82.50 (high ending of 68.50 plus the previous range of 14.00). You'll note that this is still 10 cents below the initial 23.6% retracement level of 92.58.
It's possible cotton could fully extend to the 23.6% level, but it will likely need help from supply and demand to do it. The end of December 2016 saw the nearby March-to-May spread close at a carry of 0.37. If something happens to either decrease supplies or increase demand, the nearby spread could become inverted, sparking a stronger than expected rally.
Seasonally the market tends to peak in late February before settling into a downtrend for the rest of the year. However, 2016 was a year filled with contra-seasonal patterns that could continue into 2017. For now continue to monitor both stochastics and spreads for indications on how far and fast the cotton market could move.
To track my thoughts on the markets throughout the day, follow me on Twitter: www.twitter.com\DarinNewsom
Comments
To comment, please Log In or Join our Community .