
Technically Speaking
Monthly Analysis: Livestock Markets
Live Cattle: The October contract closed at $106.575, down $5.15 on the monthly chart. October live cattle posted a bearish outside month on the long-term chart, extending the major downtrend to a new low of $103.775. Despite being sharply oversold, as indicated by monthly stochastics, the market continues to struggle fining buyers. The August low was the lowest live cattle has been since June 2011.
P[L1] D[0x0] M[300x250] OOP[F] ADUNIT[] T[]
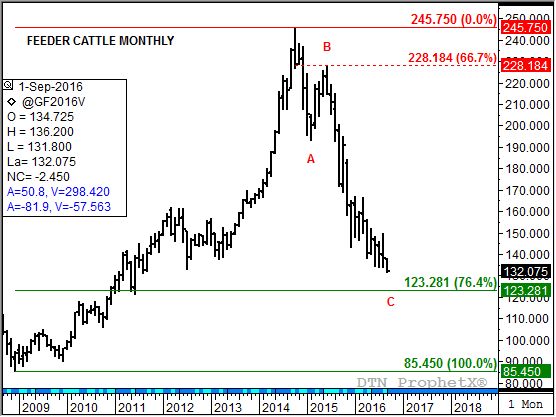
Feeder Cattle: The August contract closed at $138.35, down $1.70 on the monthly chart. The market posted another new Wave C low of $133.70 in August before rallying to close out the month. The next Wave C target is near $123.30, a price that marks the 76.4% retracement level of the previous major uptrend from $85.45 (December 2008) through the high of $245.75 (October 2014).
Lean Hogs: The October contract closed at $62.85, up $3.80 on the monthly chart. The market remains in a major (long-term) 5-Wave uptrend that began on the monthly chart with the previous Wave C low of $51.80 (November 2015). Wave 1 peaked at $90.425 (June 2016) leading to Wave 2 that looks to have bottomed with the August 2016 low of $57.575. As expected, this was a deep retracement (85%) of Wave 1, characteristic of a normal Wave 2.
Corn (Cash): The DTN National Corn Index (NCI.X, national average cash price) closed at $2.73, down 32 1/2 cents for the month. The NCI.X fell to a new major (long-term) low of $2.73 in August, dipping below the October 2014 bottom of $2.81 1/2. While the market looks bearish because of this, it could still be argued that the major trend is sideways between support at the combined lows and resistance between the peaks of $4.05 3/4 (July 2015) and $4.00 1/2 (June 2016). It will be important to see what the NCI.X does in September, with monthly stochastics well below 20% indicating the market is sharply oversold.
Soybean meal: The more active December contract closed at $306.70, down $41.00 on the continuous monthly chart. The market remains in a major (long-term) 5-Wave uptrend, with the ongoing secondary (intermediate-term) Wave 2 downtrend resulting in at test of support between $317.60 and $303.00. These prices mark the 67% and 76.4% retracement levels of Wave 1 from $267.20 through the high of $418.70. A characteristic of Wave 2 is a deep Wave 1 retracement.
To track my thoughts on the markets throughout the day, follow me on Twitter: www.twitter.com\DarinNewsom


Comments
To comment, please Log In or Join our Community .