
Technically Speaking
More Bullish Signals by the USDX

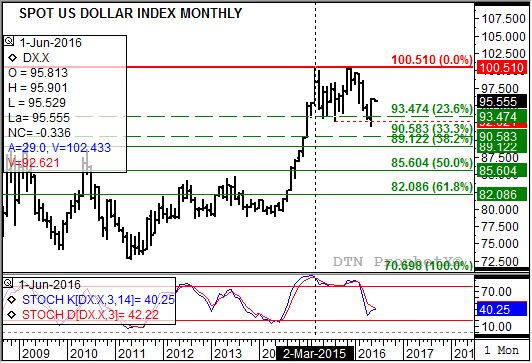
Following up on its recent secondary (intermediate-term) bullish signals, the U.S. dollar index (USDX) also established bullish long-term patterns during June. Most notably, a bullish outside monthly range that could be viewed as key reversal of the previous major (long-term) downtrend.
Take a look at the attached monthly chart. Note that the USDX posted a low of 91.919 and a high of 95.968 before closing at 95.891. Compare this to May's numbers of 93.007, 95.200, and 93.082. If not for one other indicator, this would be a clear example of a bullish key reversal indicating the major trend has turned up and further implying the Federal Reserve is set to make a move on interest rates in June.
The only shadow of a doubt comes from monthly stochastics (bottom study). Note that momentum had not weakened below the oversold 20% level before the USDX established its bullish reversal. Normally when a market turns it major trend it does so with the benefit of a corresponding crossover of stochastics below oversold (or above overbought at 80%).
This leaves the door open to a possible bearish surprise by the Fed later this month. Still, the fact a bullish reversal was seen on the monthly chart could get traders' attention early in the month.
To track my thoughts on the markets throughout the day, follow me on Twitter:www.twitter.com\Darin Newsom
P[L1] D[0x0] M[300x250] OOP[F] ADUNIT[] T[]
Comments
To comment, please Log In or Join our Community .