Fundamentally Speaking
Soybean Planted Area Changes
USDA prospective plantings figures will be released March 31 and there is talk soybeans may get the short end of stick relative to corn as indicated by USDA at their annual Ag Outlook Forum.
This is being reinforced by a rather steep drop in November soybean/December corn ratio from high of 2.57 on March 9 to 2.36 in two weeks.
Of course, soybean acreage can vary quite a bit from what the March intentions figures show, though for the past four years in a row, the planted area figure has been lower in the final production report than what was indicated at the end of March.
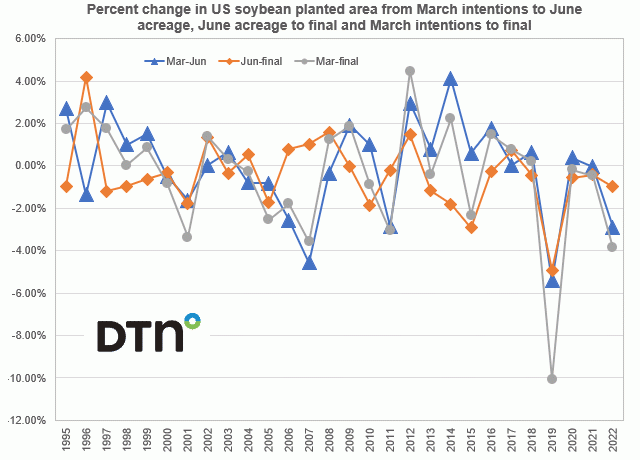
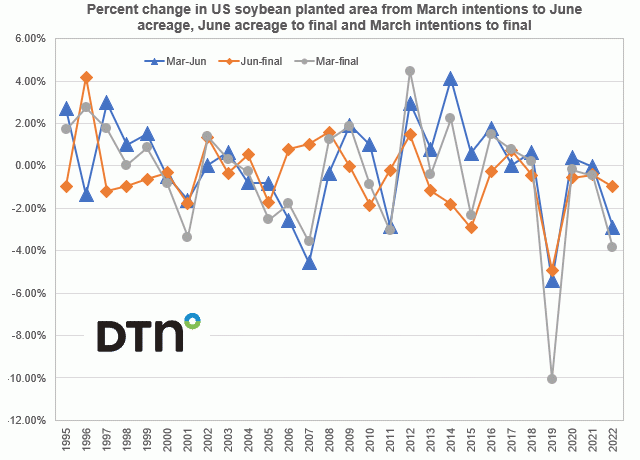
This chart shows the percent change in U.S. soybean planted area from the March intentions to June acreage report, the June acreage to the final production figure and also the March intentions to the final number.
Last year's 3.9% decline or 3.505 million acre drop in soybean planted area was the second largest between the March prospective planting figure and the final production number since 1995 topped only by the 10.0% or 8.52 million acre drop in 2019.
Both last year and back in 2019 a wet spring delayed both corn and soybean plantings as farmers stuck with corn to the detriment of soybeans.
One wonders whether we may see a repeat this year as a lot of corn and soybean ground is pretty saturated after rather substantial moisture was seen over the past few months.
So, in addition to market action accentuating the fortunes of corn over soybeans, recent history shows final bean area often coming in well below what farmers had intended.
(c) Copyright 2023 DTN, LLC. All rights reserved.
P[L1] D[0x0] M[300x250] OOP[F] ADUNIT[] T[]


Comments
To comment, please Log In or Join our Community .